

Export and import data is now available for the third quarter of 2019. This post will cover cheese and butter, the most important commodities in the Class III price calculation. By comparison, the first half export/import analysis can be seen here.
CHEESE
Cheese net exports (exports less imports) are shown cumulatively in Chart I for 2018 and 2019. The two parallel each other very closely. Through the third quarter of 2019, net export volumes of cheese were up by just one percent compared to the prior year.
Cheese exports reduce cheese inventories and cheese imports add to inventories. The two combined as net exports measure the total impact of exports and imports on cheese inventories. A growth of only one percent in net exports is a slower growth rate than domestic cheese production and consumption which are running between a two and three percent annual growth. Therefore, cheese net exports are a shrinking portion of cheese “disappearance.”
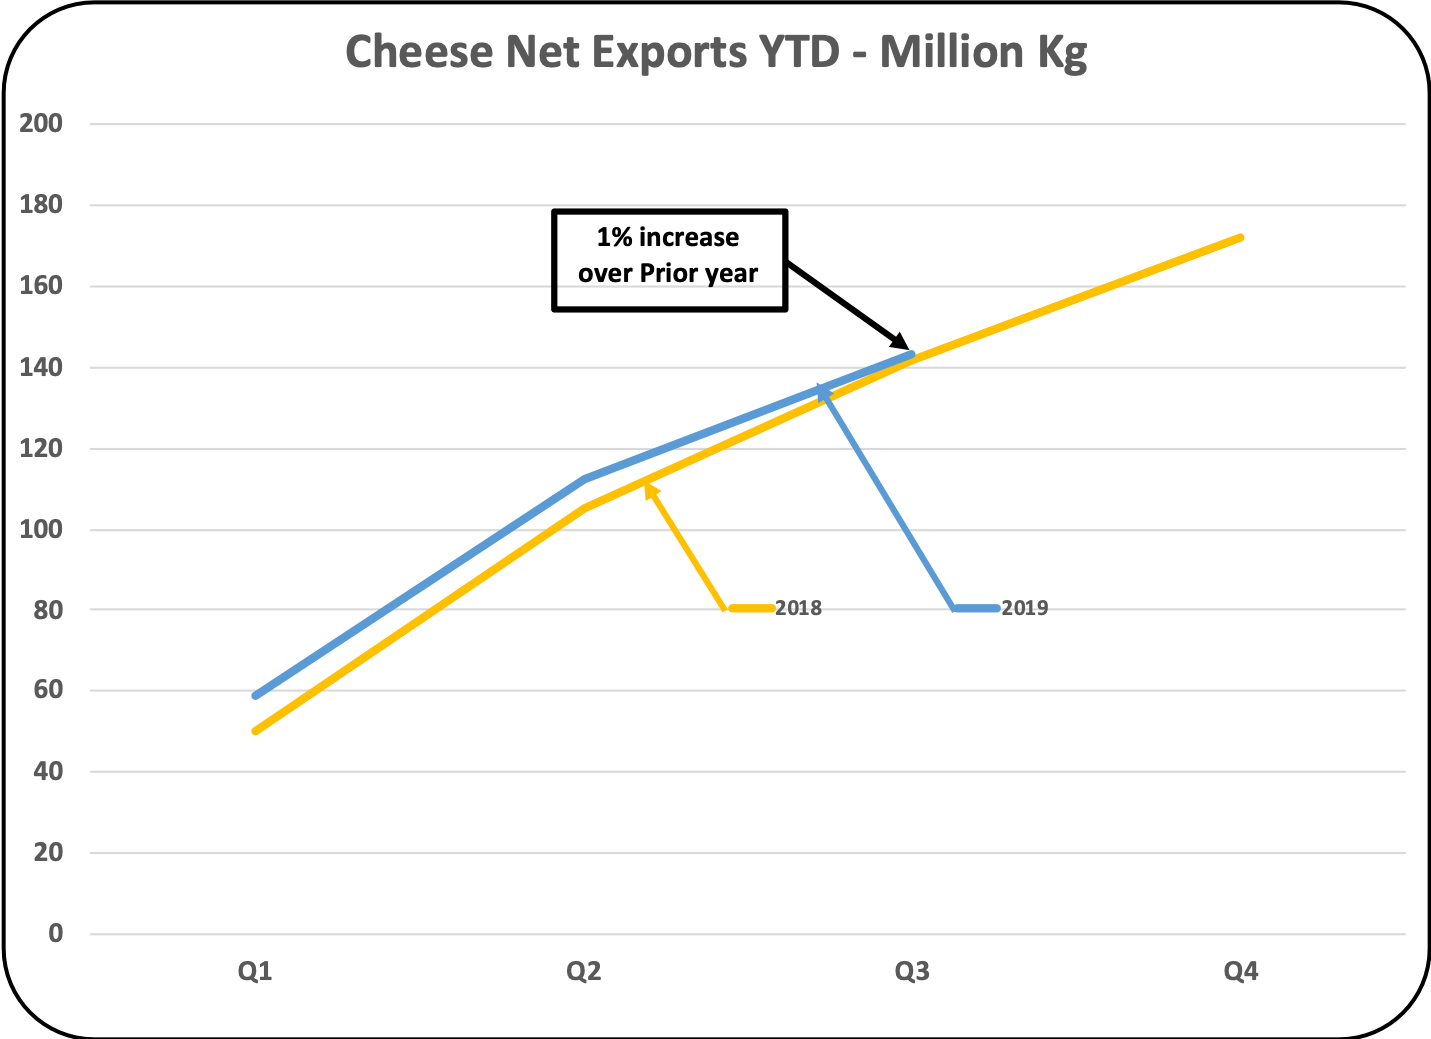 |
| Chart I – Net Exports of Cheese |
Cheese exports (not net exports) are shown in Chart II. For the first three quarters of 2019, exports were up three percent over the prior year.
 |
| Chart II – Cheese Exports |
The biggest export market for U.S. produced cheese is Mexico (Chart III). Cheese exports to Mexico are down seven percent YTD in 2019 vs. the prior year. However, there have been nice increases in cheese exports to South Korea and Japan, which largely offset the decline in exports to Mexico. The tariffs on exports of cheese to Mexico are no longer in place, but the volume of exports to Mexico have not increased.
 |
| Chart III – largest Cheese Export Markets |
Imports of cheese, Chart IV, have increased strongly in 2019, impacting the weak net export data. Imports of cheese are up six percent YTD through the third quarter of 2019. Most all of the increase has occurred in the third quarter of 2019. If this trend continues, it will have a significant impact on cheese inventories. There are typically significant increases in cheese imports in the fourth quarter holiday season.
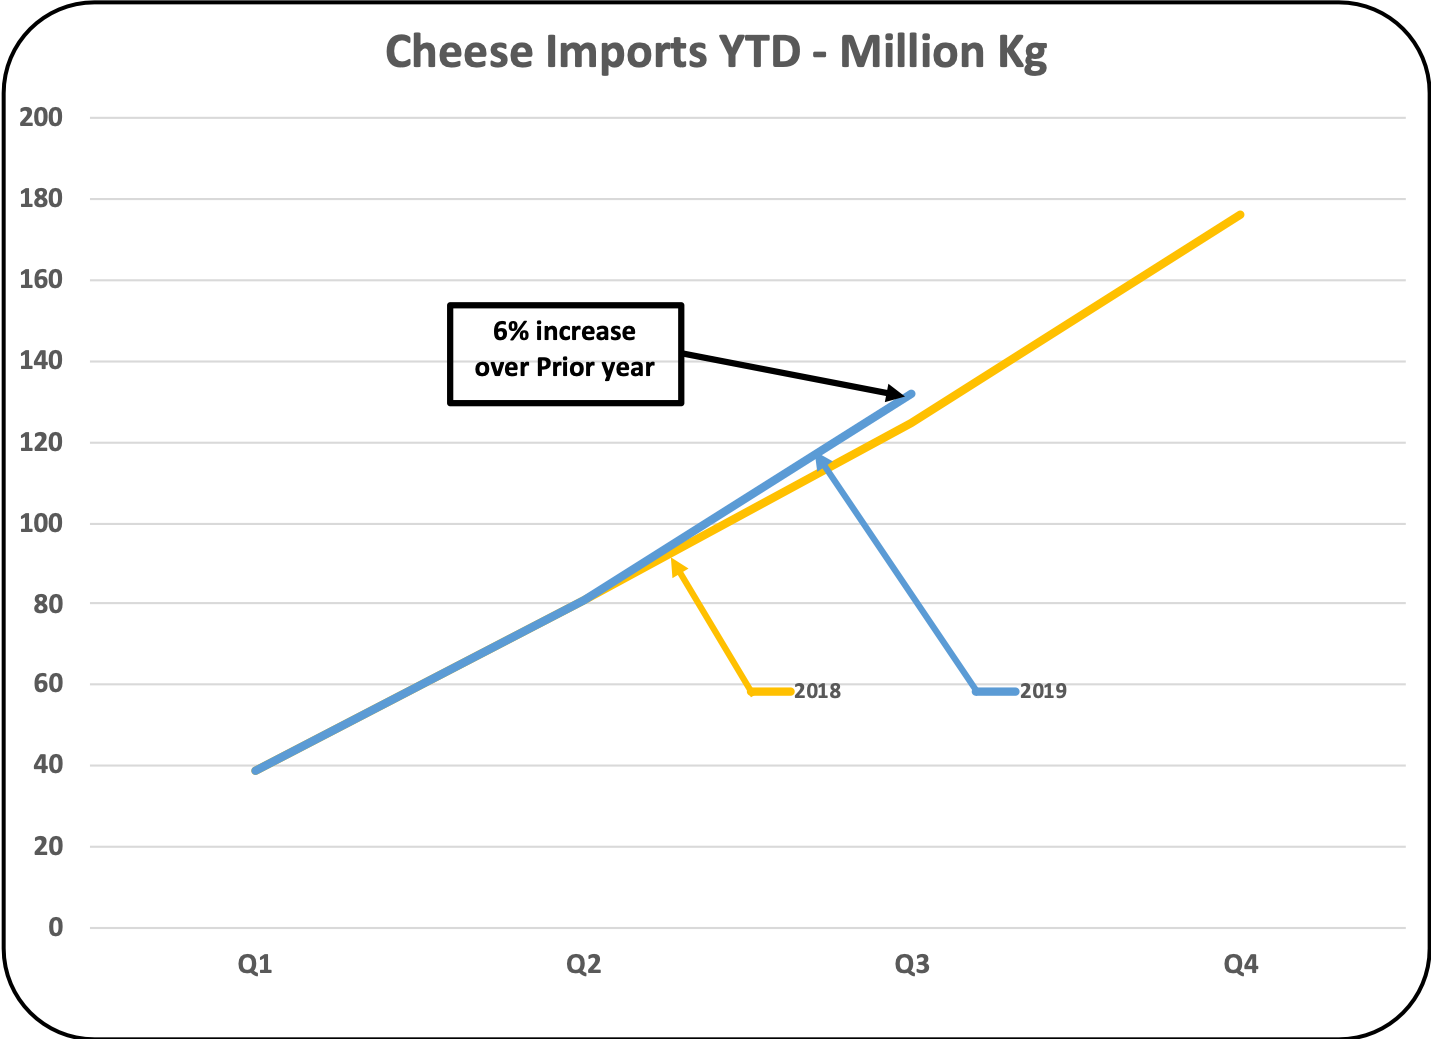 |
| Chart IV – Imports of Cheese |
Chart V shows where the imported cheese is coming from. The largest increase in cheese imports has come from the largest cheese import supplier, Italy. Imports of cheese from Italy are up 30 percent over the prior year.
 |
| Chart V – largest Cheese Import Markets |
BUTTER
Butter net exports have declined significantly in 2019 compared to 2018 (Chart VI). Net exports had fallen to negative numbers in late 2018 and that decline in net esports is now increasing. That means that the U.S. is a net importer of butter. The negative net exports increased from four million pounds of butter to 26 million pounds of butter in 2019 YTD. The change is the result of both lower exports and a surge in imports.
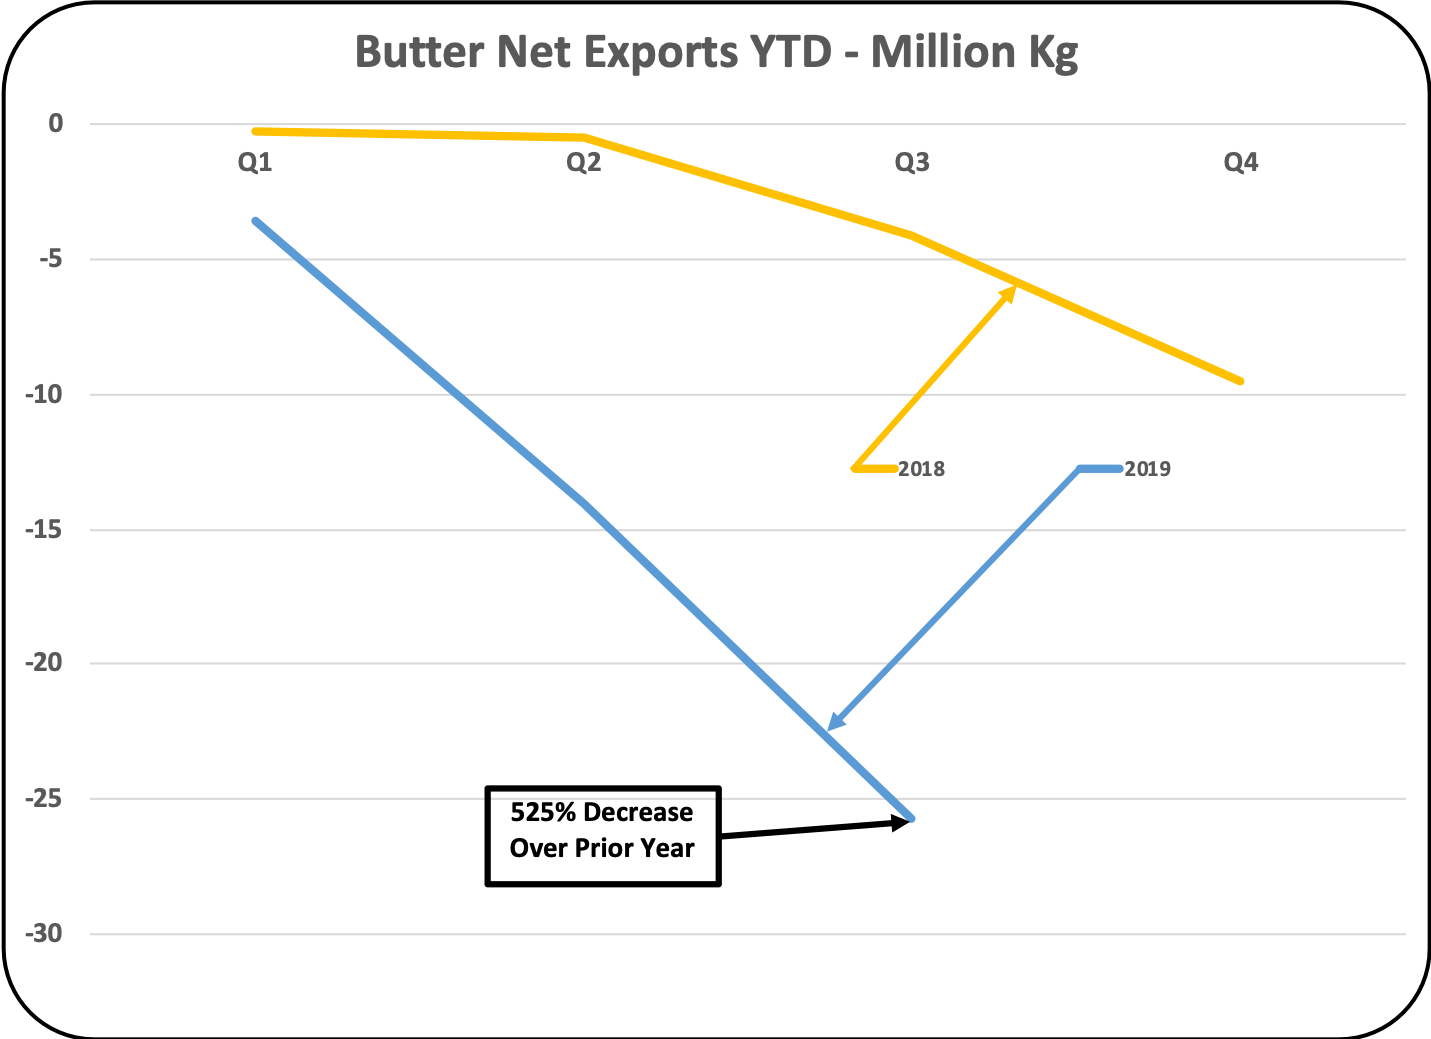 |
| Chart VI – Butter Net Exports |
Exports have been small for some time due to the strong U.S. consumer demand for butter. In 2019, those exports have dropped by another 45 percent (Chart VII).
 |
| Chart VII – Butter Exports |
 |
| Chart VIII – Butter Exports by Country |
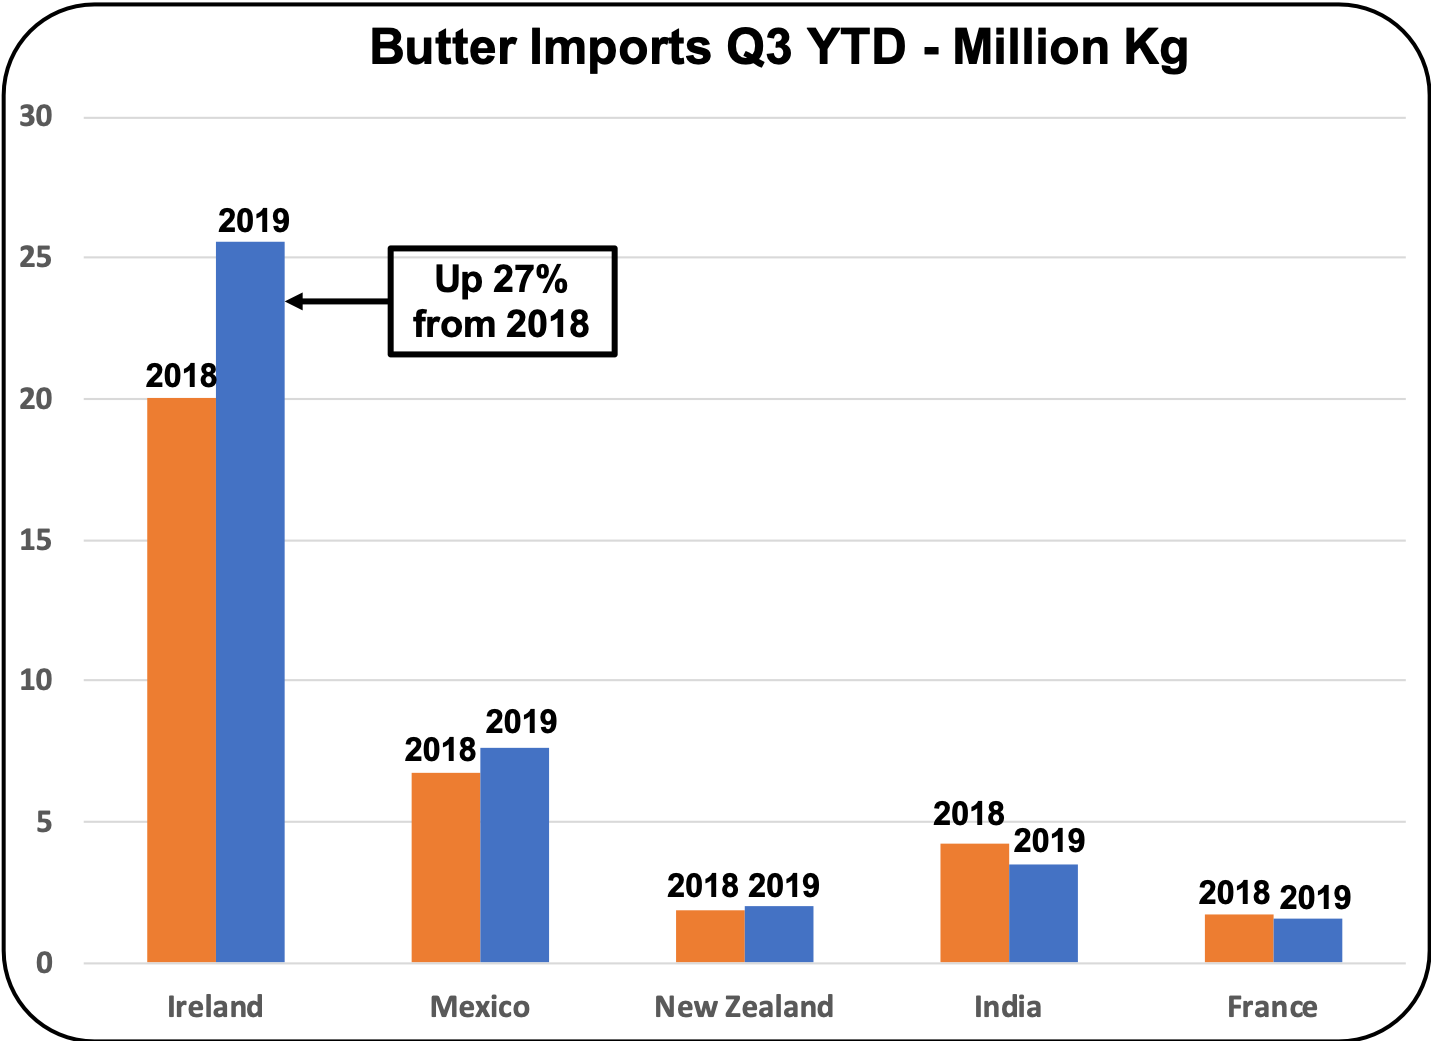
But, the real story impacting the huge drop in butter net exports is the continuing increase in butter imports (Chart IX). Butter imports YTD are up by 25 percent over the prior year.
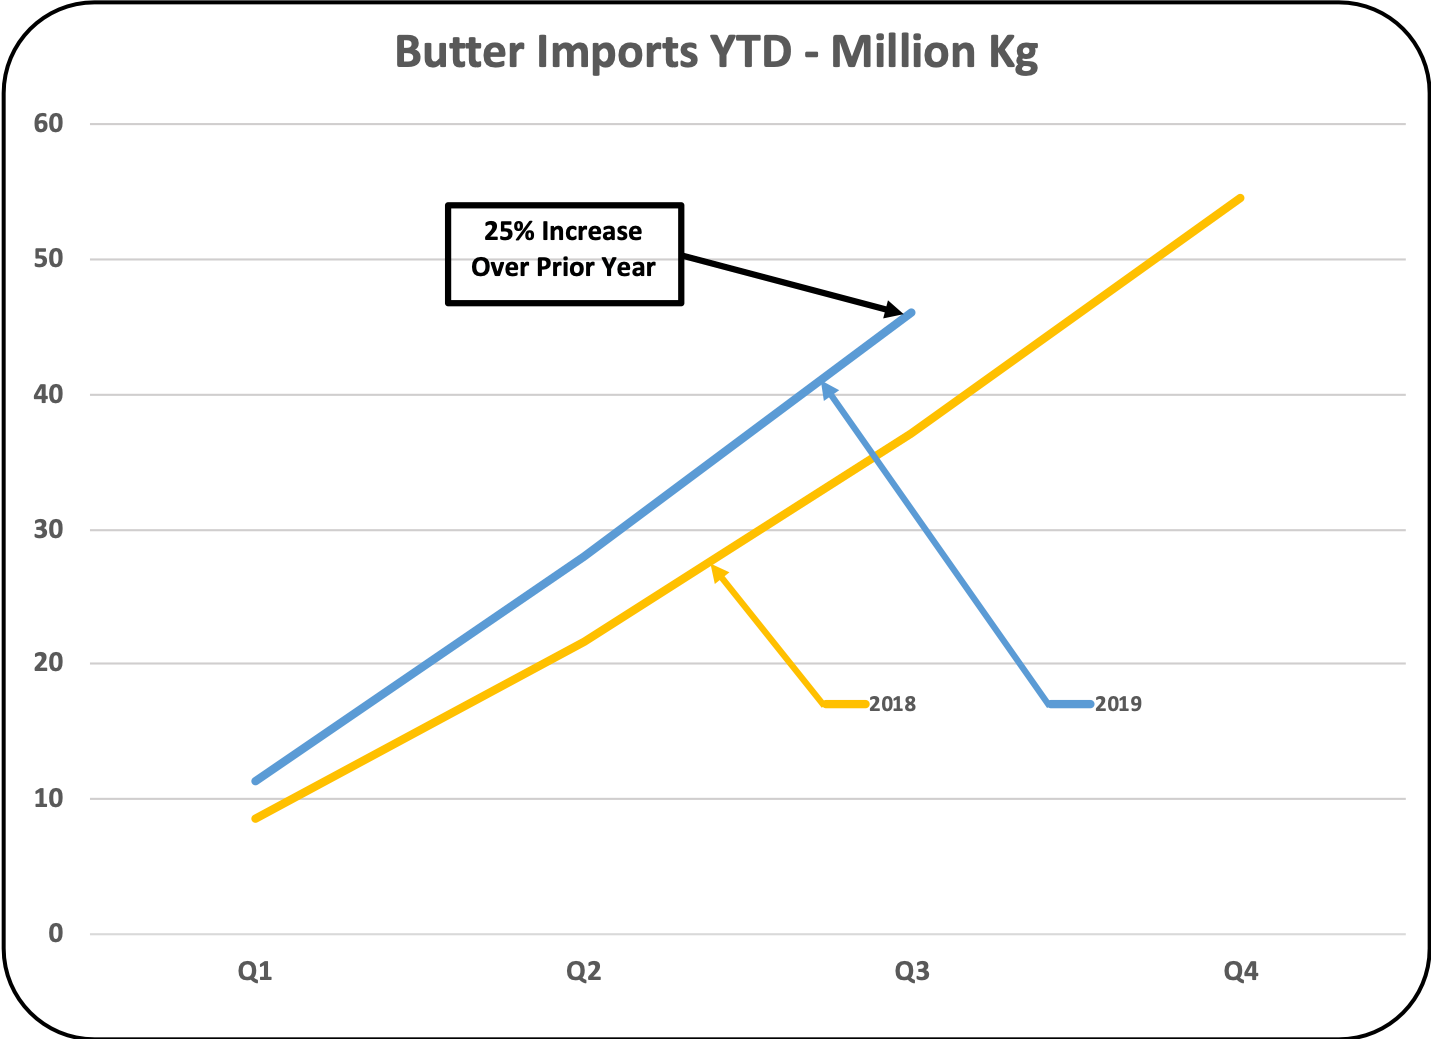 |
| Chart IX – Butter Imports |
CONCLUSION
However, the increase in cheese exports remains anemic and an expanded cheese export market is not happening! Cheese net export increases of just one percent will not soak up excess milk that results from over-production and falling dairy consumer demand.
Increased production of butter for export would also increase the production of nonfat dry milk (NDM). NDM is primarily an export item and the international market for NDM is crowded. As a result, there are limited increases in butter churning.
Perhaps with approval of the new trade agreements like USMCA, there will be increased growth of U.S. dairy exports. As of this date, those approvals seem to be held up by political squabbles.
Editor’s Note: John Geuss is a dairy consultant based in Florida. This information appears in his Milk Price blog column sponsored by Addiseo and is published here with permission. He may be contacted at johngeuss@gmail.com


Be the first to comment