
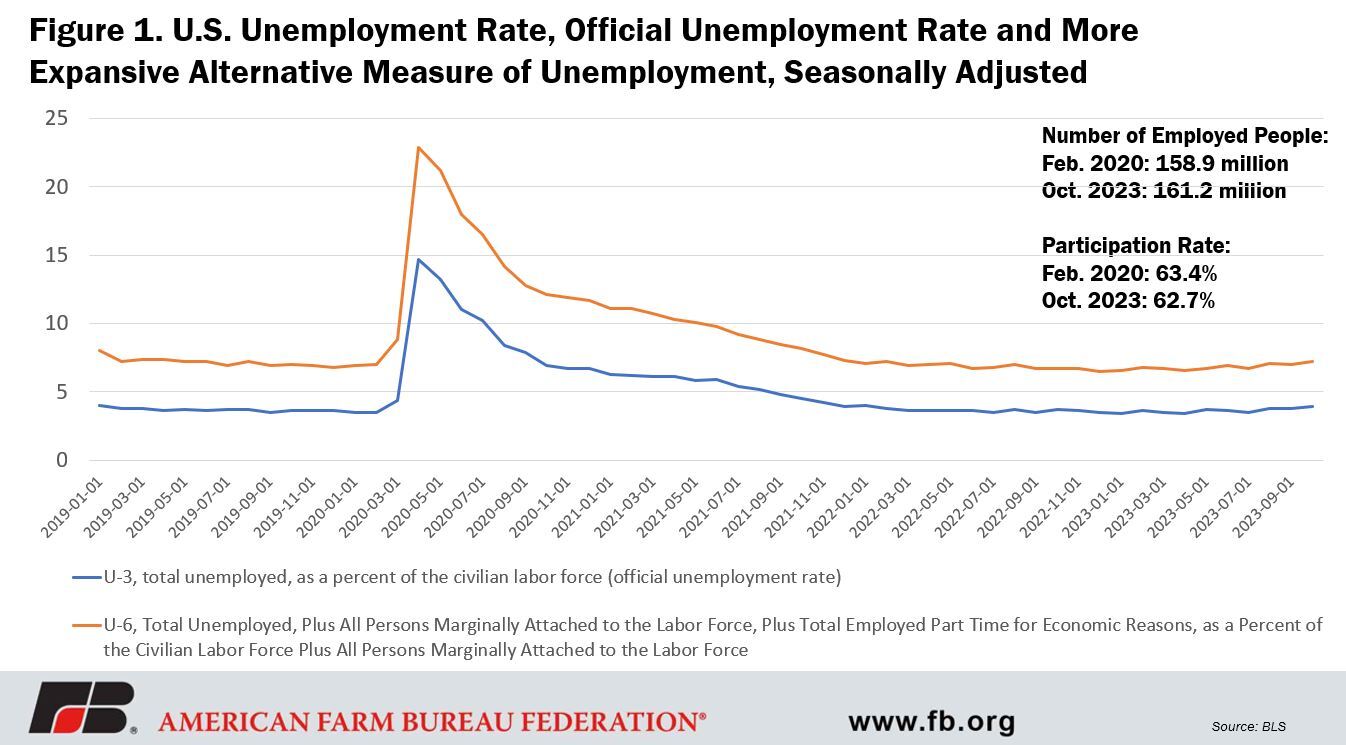
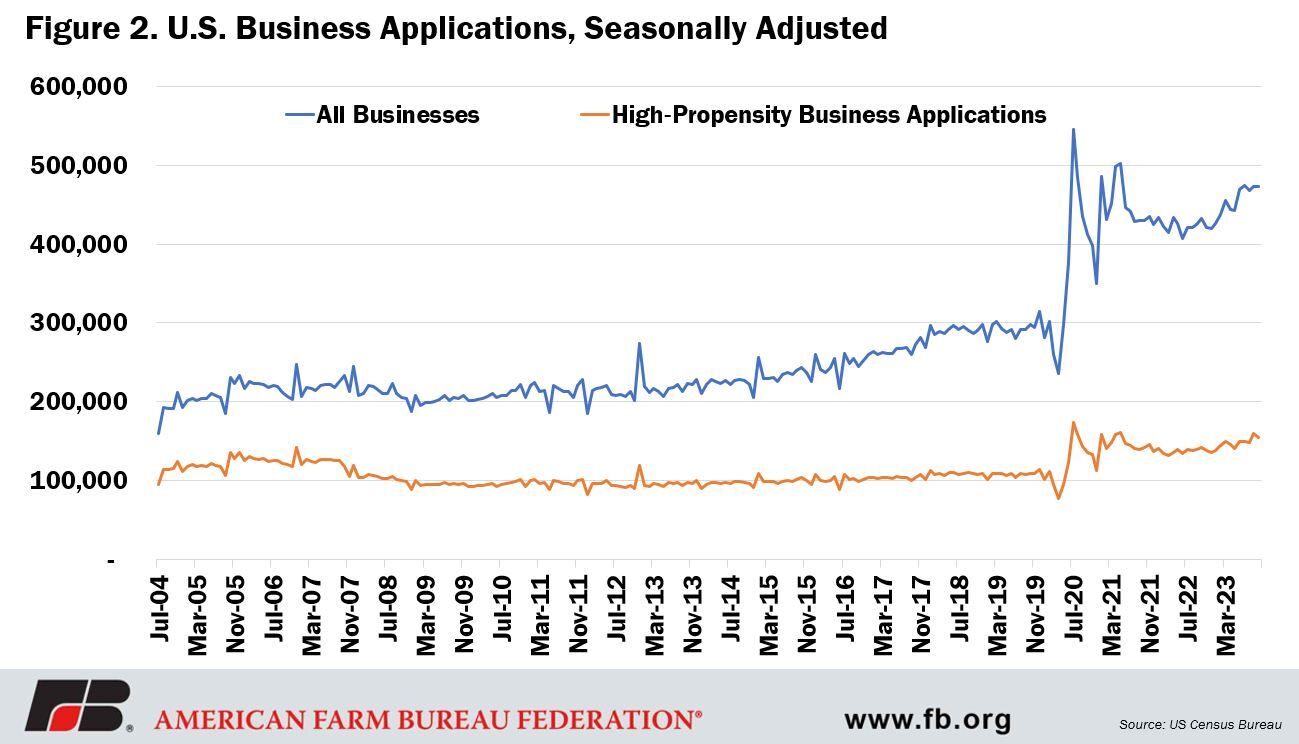
Before diving into the AEWR, we’ll take a quick look at the ongoing strength of the U.S. labor market. The official U.S. unemployment rate in October 2023 was 3.9%, only slightly higher than February 2020’s, pre-pandemic 3.5%. Certainly, a great deal of tumult was experienced in the labor market during the pandemic, with the unemployment rate reaching a painful high of 14.7% in April 2020, but thankfully those elevated rates didn’t last. The labor market settled back to 4% unemployment by January 2022. A change that does seem to have staying power, however, is an increased interest in entrepreneurship. There was a huge jump in the number of business applications in the U.S. starting around June 2020. And while the massive increase lasted about a year, the number of monthly business applications remains well above pre-pandemic levels, even in the face of rising interest rates and elevated inflation. The growth hasn’t been just single employee businesses either; applications for high-propensity businesses, a subset of business applications with a high-likelihood of turning into a business with a payroll, are also up about 25% compared to pre-pandemic levels. The formation of new businesses is a good thing but adds additional competition for workers.
Now, back to the AEWR. As mentioned above, the field and livestock workers’ combined wage rate is the basis for the AEWR, but the AEWR is not a national rate, rather it is set at the farm labor region as defined in the FLR. There are 15 farm labor regions, plus individual rates for California, Florida and Hawaii. So, while the 2023 U.S. average field and livestock workers’ combined wage rate was $17.55 per hour, up 93 cents per hour, or 5.6%, from 2022, there are considerable differences between regions. (For the purpose of this article the average field and livestock workers’ combined wage will be referred to as the wage rate.)
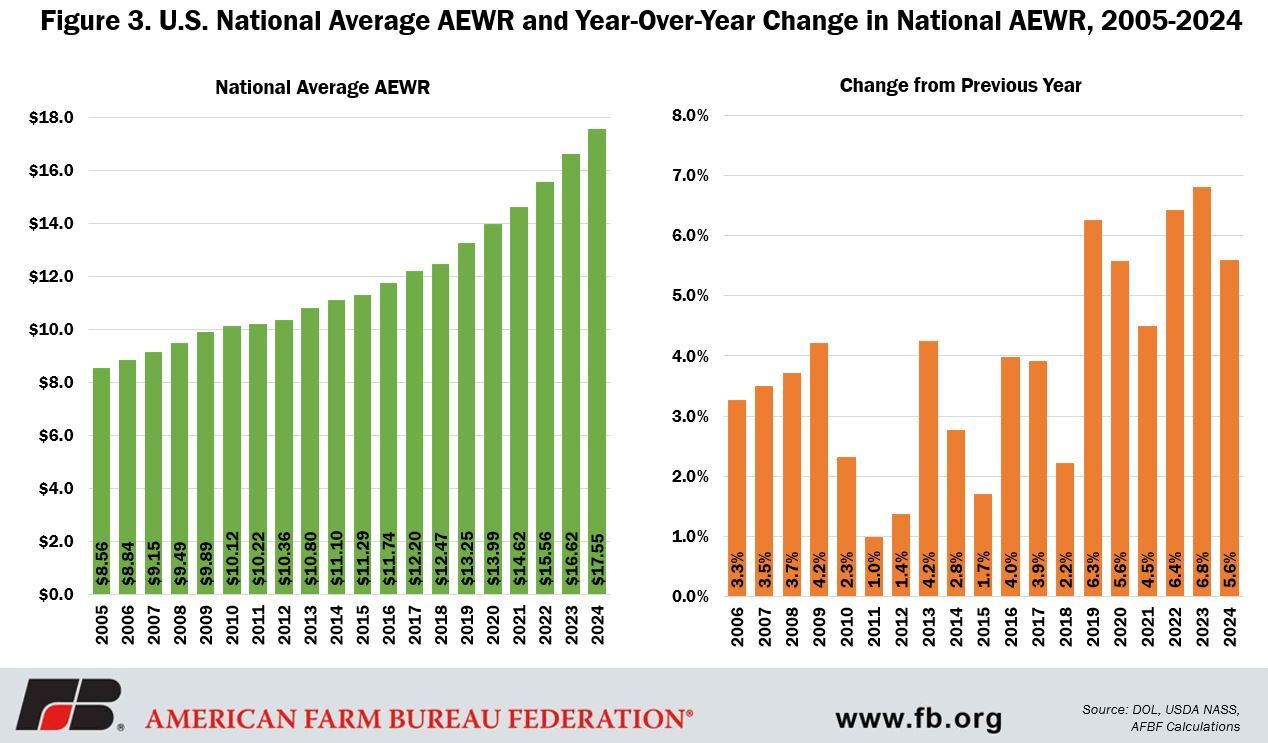
The U.S. national average wage rate has increased every year for the last 20 years. In fact it has more than doubled since 2005. However, the rate of that year-over-year change has varied considerably. Between 2005 and 2018, the year-over-year increase averaged 2.9%, but has increased significantly since. Since 2019, the yearly increases have averaged 5.9%, nearly double the rate of change in the earlier period.
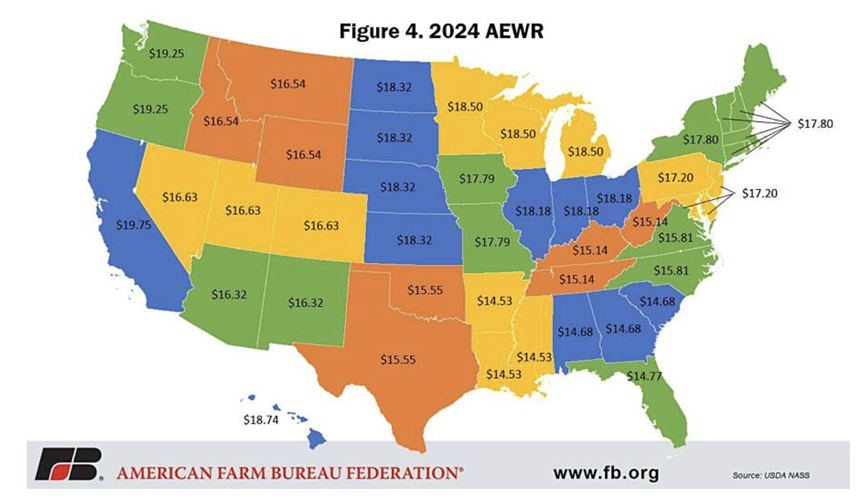
In 2023, every state will have an AEWR in excess of $14 per hour. Last year we reported the same thing, except the dollar amount was $13 per hour. Seven states (Arkansas, Louisiana, Mississippi, Alabama, Georgia, South Carolina and Florida) will have an AEWR between $14 and $14.99. Seven states (Kentucky, Tennessee, West Virginia, Oklahoma, Texas, North Carolina and Virginia) will have an AEWR between $15 and $15.99. Eight states (Arizona, New Mexico, Idaho, Montana, Wyoming, Colorado, Nevada and Utah) will have an AEWR between $16 and $16.99. Thirteen states (Delaware, Maryland, New Jersey, Pennsylvania, Iowa, Missouri, Connecticut, Maine, Massachusetts, New Hampshire, New York, Rhode Island and Vermont) will have an AEWR between $17 and $17.99. Eleven states (Illinois, Indiana, Ohio, Hawaii, Kansas, Nebraska, North Dakota, South Dakota, Michigan, Minnesota, Wisconsin and Hawaii) will have an AEWR between $18 and $18.99. And three states (Oregon, Washington and California) will have an AEWR in excess of $19 per hour.
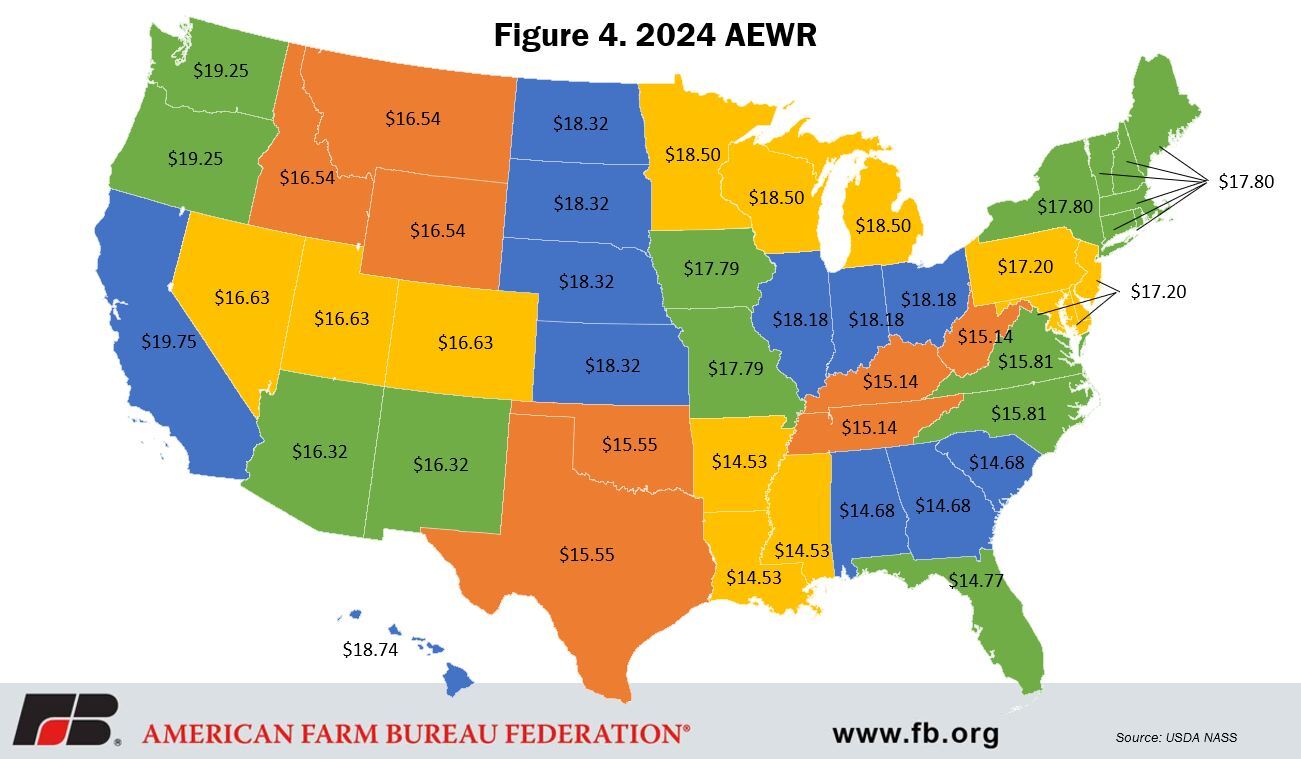
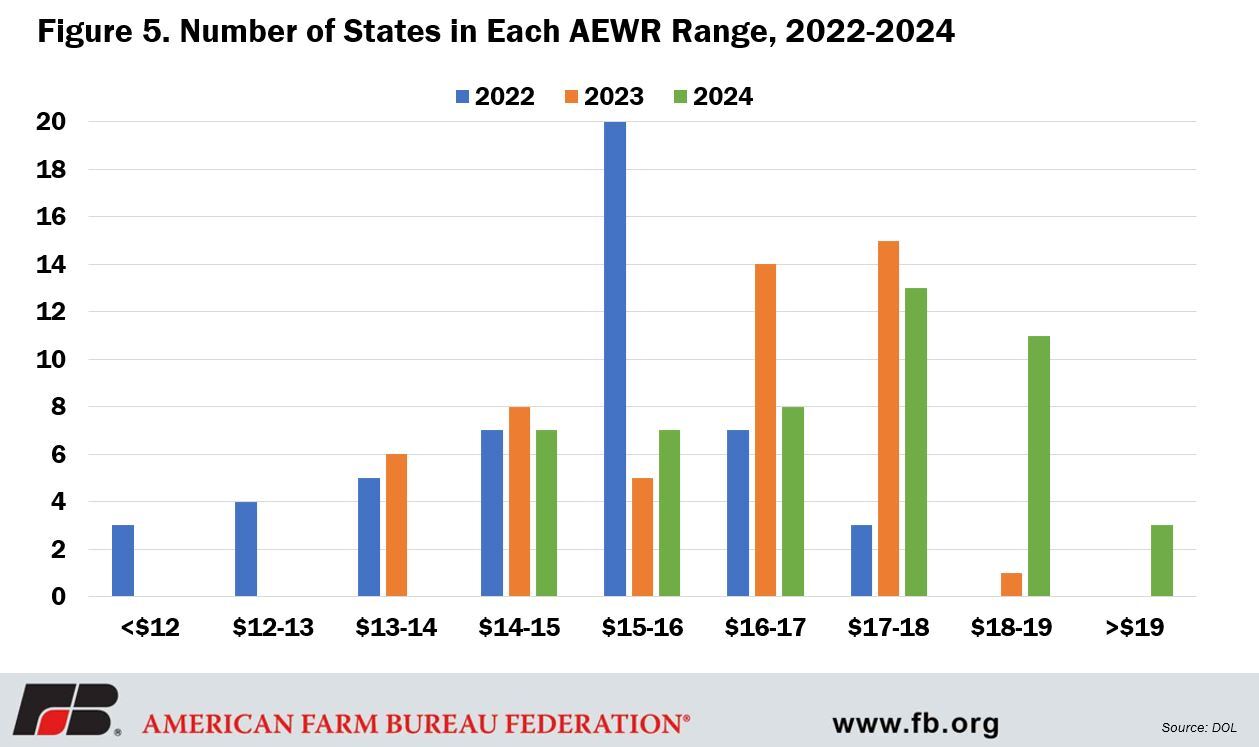
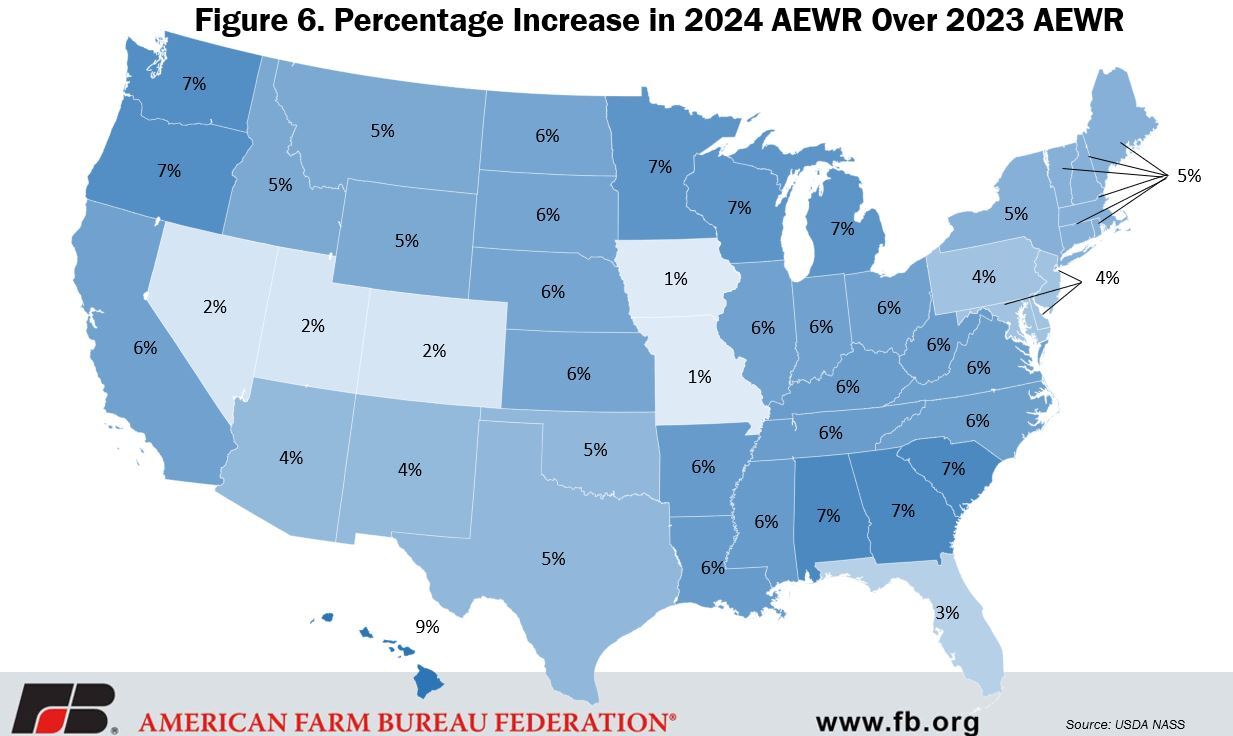
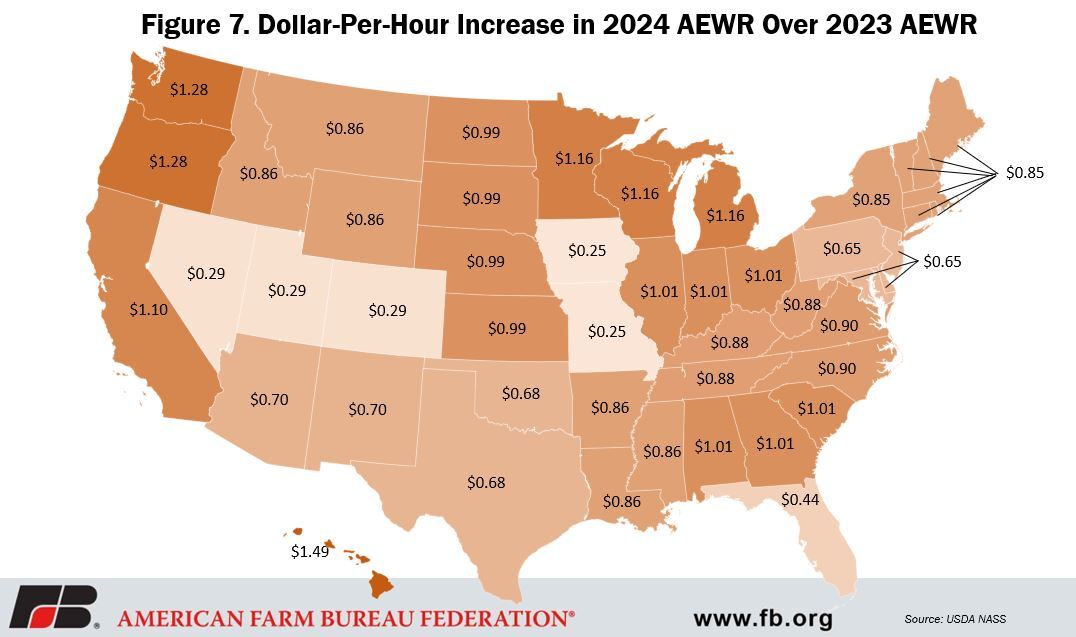
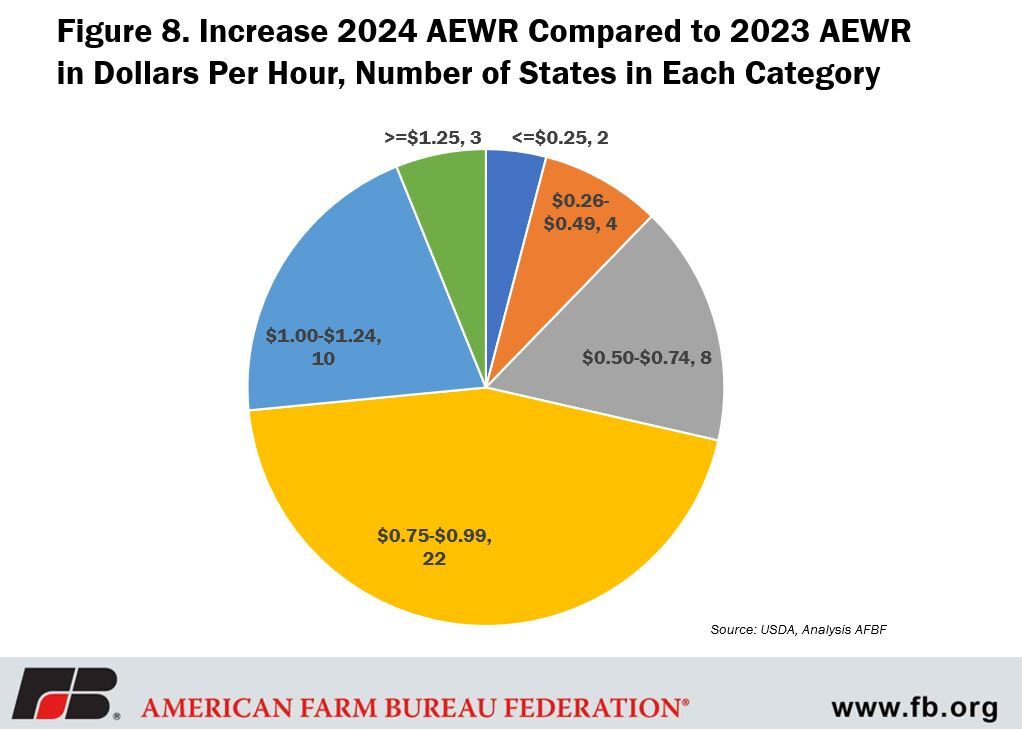
Like in 2022, every farm labor region and state experienced a higher average wage rate in 2023 and will subsequently have a higher AEWR in 2024. The Cornbelt II region (Iowa and Missouri) had the smallest increase in terms of dollar per hour and percentage with a 25-cents-per-hour, or 1.4%, increase. Hawaii had the largest increase, both in terms of dollar per hour and percentage – 8.6% and $1.49. Once again in 2023, California had the highest overall wage rate at $19.75 per hour. Sixty percent of states will experience an AEWR wage increase between 50 cents and 99 cents per hour in 2024. Another 20% of states will see an increase between $1 and $1.24 per hour. Nearly 50% of states will have an AEWR between $17 and $19 in 2024.
Conclusion
While the H-2A program is utilized by farmers and ranchers across the U.S. for a variety of seasonal or temporary farm work, it is most closely associated with the fruit and vegetable sector, often referred to by the short-hand phrase, specialty crops. Like all other farmers and ranchers, specialty crop growers face a 2024 growing season filled with elevated input costs from diesel fuel, electricity, seeds, fertilizer and cash rent to interest rates, just to name a few. With the release of the FLR we now know that labor costs will also be rising. With labor costs accounting for up to 38.5% of total production expenses in the fruit and tree nuts sector and 28.5% in the vegetable and melons sector (Castillo et al., 2021), this increase is no small part of the budget. Meanwhile, DOL and the Department of Homeland Security have combined to publish six new costly regulations that will have a significant impact on the H-2A community in 2023 alone. Altogether,Agricultural Statistics 2024 is likely to be a doozy for farmers and ranchers with labor needs.



Be the first to comment