
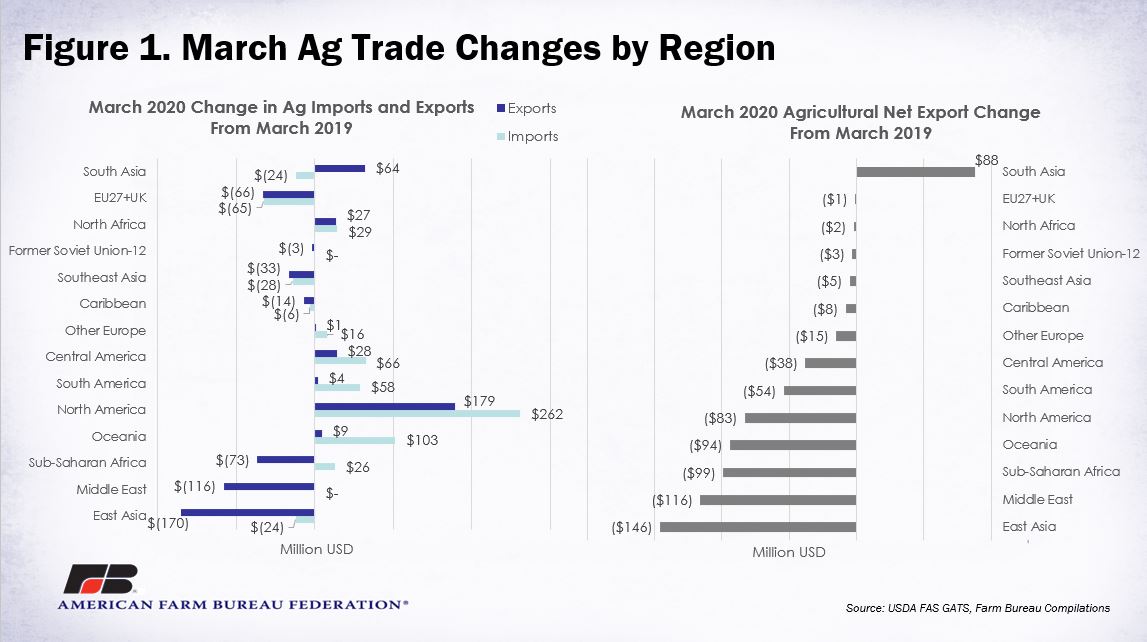
Overall, the U.S. had a negative ag trade balance of $501 million in March 2020, down sharply from March 2019, when the balance was positive $70 million. March 2020’s year-over-year decline was fueled by a 1% decrease in exports, while imports rose 3%. On a regional basis, the U.S. saw a decline in net exports in all regions, except for South Asia. In many regions, both exports and imports in March 2020 were higher than in March 2019, though the growth in imports outpaced exports. For example, in North America, U.S. exports rose $179 million, while imports rose $262 million, leading to a net export loss of $83 million in March 2020 compared to March 2019. Unsurprisingly, the region with the largest decline in net exports was East Asia, which includes China.
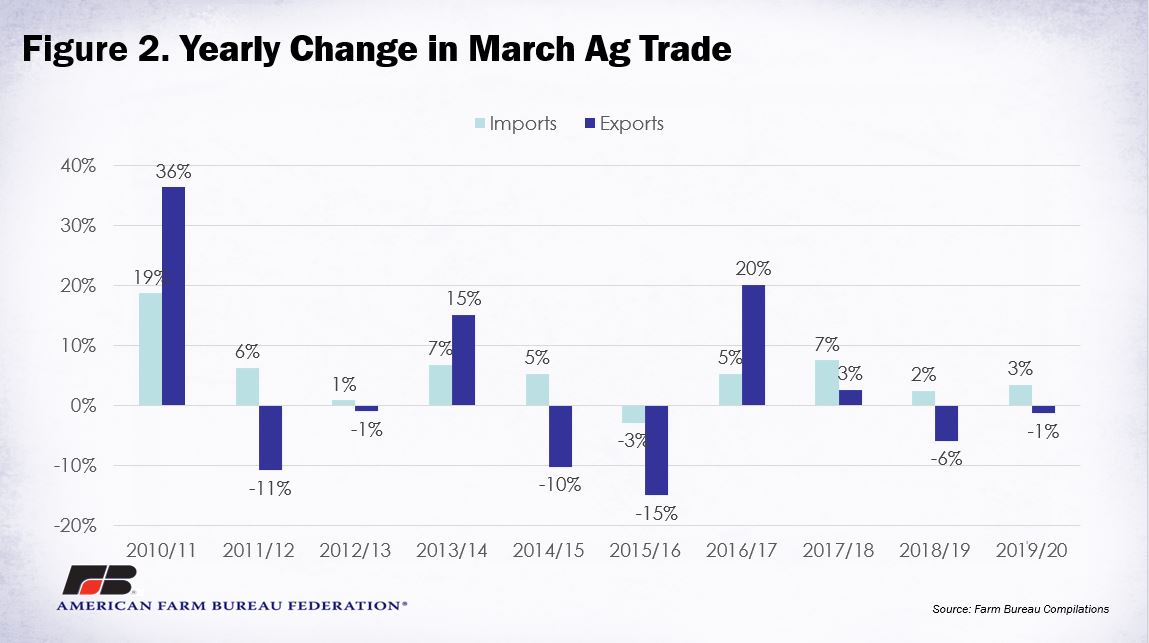
Certainly some of these changes are attributable to COVID-19, as we see in Figure 2, but March trade has shown quite a lot of variability over the years. The 3% increase in imports in 2020 is largely in line with the 2019 increase, but below the 2017 and 2018 increases. Meanwhile, March ag exports have varied widely, from an increase of 20% to a decrease of 6%, and that’s just in the previous three years.
Digging into the import data highlights which product areas posted the largest changes in March 2020, compared to the same month in 2019. Ag products are generally divided into three categories: bulk commodities, such as corn and soybeans; intermediate goods, like planting seeds and sugar; and consumer-oriented goods, like red meats and fresh fruit.
Intermediate goods, which account for 19% of imports, had the largest increase in imports among all categories – approximately a 10% bump over March 2019. This was led primarily by growth in imports of tropical oils, planting seeds, cocoa paste and cocoa butter and sugars and sweeteners. Accounting for 10% of U.S. agricultural imports, bulk commodities increased 4% in March 2020, compared to March 2019. The leading product of growth within bulk commodities was cocoa beans. The products with the largest increases in both intermediate and bulk commodities seem to support observations that many Americans have turned to baking, wellness and planting home gardens during this challenging time.
Despite the interesting changes in the intermediate and bulk commodity categories, the majority of agricultural imports in March 2020, approximately 71%, were consumer-oriented goods. Overall, imports of consumer-oriented goods were up 2% in March 2020, compared to March 2019, though there are some more interesting stories a little deeper in the data.
The second-largest product by value within the consumer-oriented category, with imports of $1.03 billion, was fresh vegetables, which were up 6% month over month. Within fresh vegetable imports, the direction of import change was far from uniform. Among the leading crops, tomatoes, cucumbers and squash imports increased by 20%, 17% and 47%, respectively. Meanwhile, imports of peppers dropped by 13% and asparagus imports dropped by 22%.
Things were also interesting in the red meat case. Overall, imports of fresh and frozen beef and pork were $628 million, up 7% in March 2020 compared to March 2019. However, breaking beef and pork apart reveals that while March beef imports, at $552 million, were up 14%, pork imports, at $77 million, were down 25%. Pork imports were down from all four top supplying countries, Canada, Denmark, Poland and Mexico. The increase in beef imports was largely attributable to Australia and New Zealand, which increased by $20 million or 19% and $40 million or 56%, respectively.
Beyond fruits, vegetables and red meat, two other significant import items changed considerably change. Imports of wine and beer were down 10% in March 2020 compared to March 2019. This is consistent with the experience of grocery store sales in Europe which also reported declines in sales of foreign-produced alcoholic beverages. Finally, month over month imports of snack foods increased by 10%, as Americans stayed home nibbling throughout the day.
Conclusion
March trade data begins to highlight the challenges producers are facing beyond production. While contracts for imported grocery store items were likely signed months before the COVID-19 outbreak, increasing imports mean even more competition for grocery store space in an already extremely disrupted supply chain. One month does not make a trend, but all eyes will certainly be on the April trade data when it is released on June 4.


Be the first to comment