

The prior post was titled “EXCELLENT NEWS” as cheese inventories were still in line at the end of March and the USDA’s had issued a plan to buy huge amounts of dairy products in the coming months. The post ended with the phrase “As with everything about COVID-19, the future has uncertainties.” Inventories of cheese and butter for the end of April were released on May 21 and cheese and butter inventories had swelled to record highs and are no longer “in line.”
High cheese inventories cause lower cheese prices and lower cheese prices reduce producer milk prices.
The huge dairy buying program included in the CFAP program is in place and requests for bids are open. This will hopefully bring inventories back “in line”, but there is still uncertainty as programs of this size have no history to relate to. In the prior post, the CFAP was described as a “very rich” program. It must be rich to bring relief to the devastating damage caused by the pandemic.
The charts below compare 2020 data to the prior four years. In every chart, the year 2020 was a normal year until April numbers were published. The CFAP program referenced in the prior post must now supply enough demand to reduce existing inventories in the upcoming months.
The increase in total cheese inventories are shown in Chart I. Cheese inventories increased from 1373 to 1483 million pounds in April. This was the biggest monthly increase in history. Butter inventories also grew to record highs and are covered in Chart IV below.
Some data like cheese production and disappearance for April is not yet available. On the demand side, the most obvious culprit is the lack of demand by food service. The restaurants that food service supplies were largely closed in April. Therefore, the food service companies which provide about half of the demand for dairy products were cutting back on purchases.
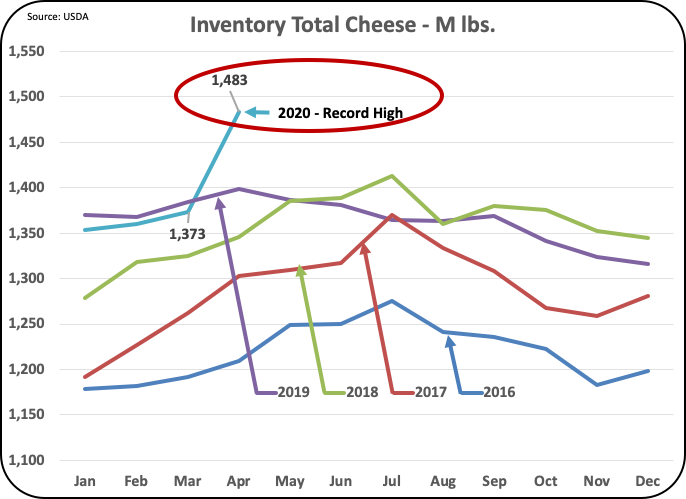 |
| Chart I – Total Cheese Inventories in Cold Storage |
Cheese in cold storage is reported by the USDA as “American Cheese” and “Other Cheese.” Charts II and III report these inventories separately. These charts allow a “drill down” to see more precisely where the major issues are.
“Other Cheese” inventories grew significantly in April but are still below the levels of the last two years. “Other Cheeses” are mostly Italian cheeses lead by Mozzarella which accounts for 57 percent of the production of “Other Cheeses”. In March, the “Other Cheeses” inventory was below the prior four years in spite of growing demand, so those inventories could absorb increases without reaching record levels. The demand for Mozzarella delivered by food service may have remained strong as pizza is a major user of Mozzarella and pizza sales are reported up during the “Stay-at-Home” order period.
 |
| Chart II – Other Cheese Inventories in Cold Storage |
 |
| Chart III – American Cheese Inventories in Cold Storage |
 |
| Chart IV – Butter Inventories in Cold Storage |
Based on the CFAP program of Food Assistance which will begin buying cheese starting May 15, the excessive dairy inventories will likely start shrinking in June. But the inventories will not normalize until near the end of 2020 or early 2021. Data used in this model suggests that producer milk prices will likely drop in May and then slowly return to the levels of March 2020 through the remainder of the year and will extend into the early 2021.
Models are just as good as the assumptions made. The extraordinary circumstances of the COVID-19 pandemic create uncertainty. The CFAP program and assumptions for this model are as follows:
-
The CFAP as issued on May 8 will provide $1120 million for dairy purchases. They are programed to spend $100 million a month starting May 15, 2020. A supplemental program aimed at the third quarter of 2020 will provide an additional $120 million of dairy purchases.
- Because the CFAP provides dollars of purchases, a price per pound for cheese is needed to convert this into pounds of cheese purchases. The prices used in two versions of the model are the average of the last 12 months of cheese prices, $1.82/lb. and the April low of $1.40/lb.
- The model assumes that 50 percent of the CFAP dairy purchases will go to cheese. That is roughly the ratio of milk usage for cheese vs. other dairy products.
- Because the government cheese purchases will be given away, estimates of cannibalization of retail purchases are used in the model to reduce the impact of the purchases. The estimates used in the model assume a range of no cannibalization to 25 percent cannibalization of retail purchases.
- Normal cheese inventories are assumed to be the March 2020 ending inventory levels. At that time the Class III price was $16.25/cwt.
Editor’s Note: John Geuss is a dairy consultant based in Florida. This information appears in his Milk Price blog column sponsored by Addiseo and is published here with permission. He may be contacted at johngeuss@gmail.com


Be the first to comment