
Respondents to the Chicago Fed’s agricultural survey covering the fourth quarter of 2019 sounded more optimistic than a year ago, even though the results for farmland values mirrored those from the fourth quarter of 2018. On balance, the Seventh Federal Reserve District saw no annual change in its agricultural land values in 2019. Yet, values for “good” farmland in the fourth quarter of 2019 were up 1 percent from the third quarter, according to 142 survey respondents representing agricultural banks across the District. Eighty-two percent of the survey respondents expected farmland values to be stable during the January through March period of 2020, but 7 percent expected them to rise during the first quarter of 2020—a little less than the 11 percent who expected them to decline.
The District’s agricultural credit conditions showed some signs of improvement in the fourth quarter of 2019. A slightly smaller percentage (2.2 percent) of current agricultural borrowers were not likely to qualify for operating credit at the survey respondents’ banks in 2020 than in 2019. Also, the index of repayment rates on non-real-estate farm loans for the October through December period of 2019 reached its highest level since the third quarter of 2014. Non-real-estate loan demand in the fourth quarter of 2019 was above the previous year’s level, as were funds available for lending by survey respondents’ banks. The average loan-to-deposit ratio for the District was 78.9 percent in the fourth quarter of 2019—almost identical to the average of a year ago. Average interest rates on farm operating, feeder cattle, and farm real estate loans had moved down by the end of 2019 to levels not seen since the end of 2017.
Farmland values
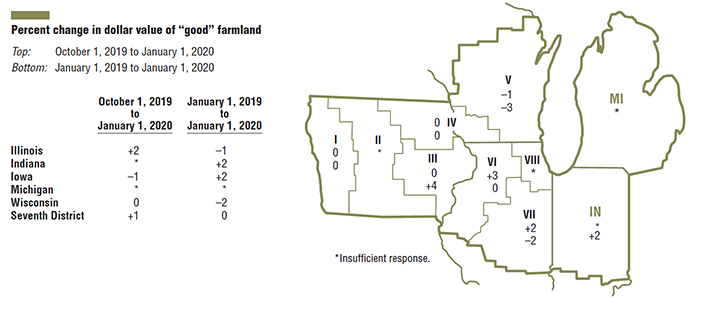
On the whole, there was no annual change in “good” agricultural land values in the District for 2019; that is, the District’s farmland values in the fourth quarter of 2019 were essentially the same as a year ago (see table and map below). In the fourth quarter of 2019, Indiana and Iowa experienced year-over-year increases in agricultural land values of 2 percent, whereas Illinois and Wisconsin experienced decreases of 1 percent and 2 percent, respectively. (Compared with a year ago, Michigan farmland values seemed to be flat, yet not enough Michigan bankers responded to provide a conclusive result.) The District’s farmland values increased 1 percent in the fourth quarter of 2019 relative to the third quarter.
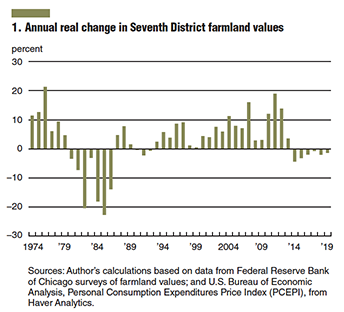
With inflation taken into account, District farmland values had a yearly decrease of a little over 1 percent in 2019; in real terms, the decrease in 2019 was smaller than the one in 2018 because of a dip in inflation (see chart 1). This was the sixth straight annual real decline.
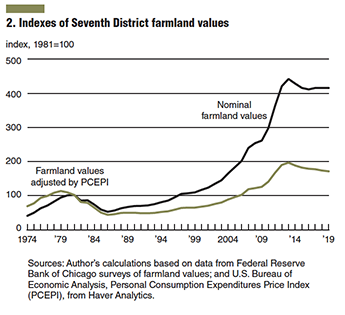
District farmland values fell 13 percent in real terms from their peak in 2013 to the end of 2019. But the decrease in agricultural land values over this span was just 6 percent in nominal terms (see chart 2).
 Weather challenges hurt the five District states’ crop production in 2019—which helped keep farmland values from changing. Based on calculations using U.S. Department of Agriculture (USDA) data, the District states’ corn yield fell to 183 bushels per acre in 2019—down 5.8 percent from 2018.
Furthermore, the District states’ soybean yield dropped 8.9 percent from 2018 to 52.5 bushels per acre in 2019. Given that harvested acres for both crops declined relative to 2018, corn and soybean output for the District states decreased 9.7 percent and 18 percent, respectively, in 2019. Even so, U.S. crop stocks were more than adequate to fulfill demand because of trade disputes that hampered exports once again in 2019. A trade war truce between the U.S. and China was struck in late 2019, and trade talks continue. Additionally, the novel coronavirus emerged in China in December 2019. Before the USDA could fully account for the impacts of these developments on trade, it projected prices for the 2019–20 crop year of $3.85 per bushel for corn and $8.75 per bushel for soybeans (up 6.6 percent and 3.2 percent from the previous crop year, respectively). When calculated with these prices, the estimated revenues from the 2019 harvest for District states would be down 3.7 per-cent for corn and 15 percent for soybeans relative to 2018.
Credit conditions
District agricultural credit conditions exhibited signs of improvement in the fourth quarter of 2019. The share of the District farm loan portfolio indicated as having “major” or “severe” repayment problems was 5.8 percent in the fourth quarter of 2019—lower than the share reported in the final quarter of 2018. At 79 for the final quarter of 2019, the index of non-real-estate farm loan repayment rates was last higher in the third quarter of 2014. That said, repayment rates in the fourth quarter of 2019 were still lower than in the same period of the previous year, with 6 percent of sur-vey respondents reporting higher rates of loan repayment and 27 percent reporting lower rates. Moreover, non-real-estate farm loan renewals and extensions in the fourth quarter of 2019 were higher than in the fourth quarter of 2018, as 24 percent of survey respondents reported more of them and only 1 percent reported fewer.
 The responses of bankers showed that demand for borrowing to fund farm operations was higher during the October through December period of 2019 relative to the same period of 2018. With 31 percent of survey respondents re-porting an increase in the demand for non-real-estate farm loans from a year ago and 14 percent reporting a decrease, the index of loan demand was 117 in the fourth quarter of 2019.
Funds availability was above the level of a year ago for the second quarter in a row. The index of funds availability edged up to 107 (its highest value since the second quarter of 2016) in the final quarter of 2019, with funds availability higher than a year ago at 15 percent of the survey respon-dents’ banks and lower at 8 percent. The District’s average loan-to-deposit ratio was almost the same as a year earlier; but at 78.9 percent, this ratio was still 3.9 percentage points below the average level desired by the responding bankers.
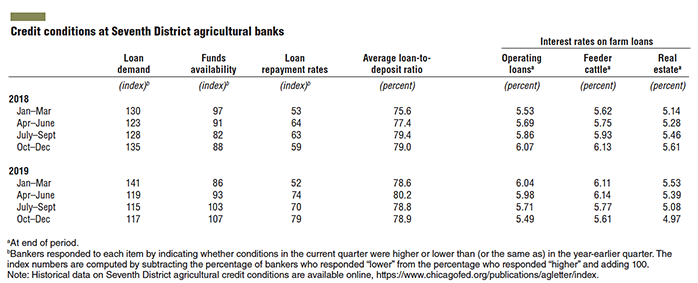
As of January 1, 2020, the average interest rates for farm operating loans (5.49 percent), feeder cattle loans (5.61 per-cent), and agricultural real estate loans (4.97 percent) were at their lowest levels since the end of the fourth quarter of 2017. While interest rates moved down, 34 percent of the survey respondents reported their banks tightened credit standards for agricultural loans in the fourth quarter of 2019 relative to the fourth quarter of 2018, and 66 percent reported the credit standards at their banks remained essentially un-changed. Similarly, 17 percent of responding bankers noted that their banks required larger amounts of collateral for customers to qualify for non-real-estate farm loans during the October through December period of 2019 relative to the same period of a year ago, and none required smaller amounts.
Looking forward
The vast majority of responding bankers (82 percent) expected farmland values to be stable in the first quarter of 2020. Notably, the share of respondents expecting farmland values to drop (11 percent) was not much larger than the share of respondents expecting them to climb (7 percent)—in contrast with the pattern seen over the past six years or so. Hence, District agricultural land values will probably be steady in the first quarter of 2020.

Be the first to comment