

This post will examine the volatile changes in Producer Price Differentials (PPDs). PPDs are intended to provide a level revenue for milk within a Federal Order so producers for all Classes of milk receive equal pay. The volatility of the PPDs has been extreme. For much of 2020, the PPD was drastically negative, reducing payments for producer milk and increasing de-pooling. They have now become positive. Why did they change? This post will build on the prior post which covered the price changes in commodities used to price producer milk. The next post will take this subject one step further to track the impact on the Uniform (average) price for producer milk.
Producers in the Federal Orders paid on the Class and Component system are first paid for the components they deliver. Later, the Uniform price for the Federal Order is calculated and the PPD is the difference between the first payment and the Uniform price. As will be covered below, the PPD changes are closely related to the price of Class III skim milk used for cheese and Class IV skim milk used for nonfat dry milk (NDM).
This post will review the PPDs in four of the large Federal Orders, and then compare them to changes in Class III and Class IV skim milk prices. In turn, the commodities that price Class III and Class IV skim milk, cheese and NDM, will be compared to the Class III and Class IV skim milk prices. The linkage between the PPD changes and the price of cheese and NDM and is very tight.
THE PPDs IN FOUR OF THE LARGE FEDERAL ORDERS
There are four charts below which show the PPD for 2019, 2020, and 2021 YTD in four of the largest Federal Orders. All these charts have the same shape, but due to the mix of milk Classes they will vary in amount. In 2020, there were major negative PPDs, with California having PPDs which reached close to a negative $10 per cwt. While the PPDs have come back to positive numbers, they have not reached 2019 levels.
The Northeast Federal Order (Chart I) has a balanced mix of Classes of milk and minimal de-pooling. It typically has positive PPDs. However, in 2020, the PPD fell to negative levels of more than $5 per cwt.
 |
| Chart I – PPDs for the Northeast Federal Order. |
 |
| Chart II – PPDs for the Midwest Federal Order |
 |
| Chart III – PPDs for the Southwest Federal Order. |
 |
| Class IV – PPDs for the California Federal Order |
What has caused these huge fluctuations in PPDs? The explanation is simple. It is caused by the variation in Class III and Class IV skim milk prices. Chart V shows the differential between Class IV and Class III skim milk prices. This chart has a high correlation to the PPDs in Charts I through IV above. The correlation can easily be seen by visually comparing the charts.
 |
| Chart V – Differential between Class III and Class IV milk prices |
 |
| Chart VI – Class III Skim Milk Prices |
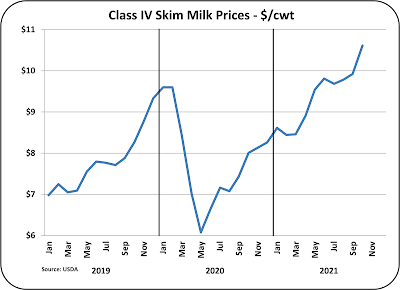 |
| Chart VII – Class IV Skim Milk Prices |
 |
| Chart VIII – Cheese Prices used to Calculate Class III Skim Prices |
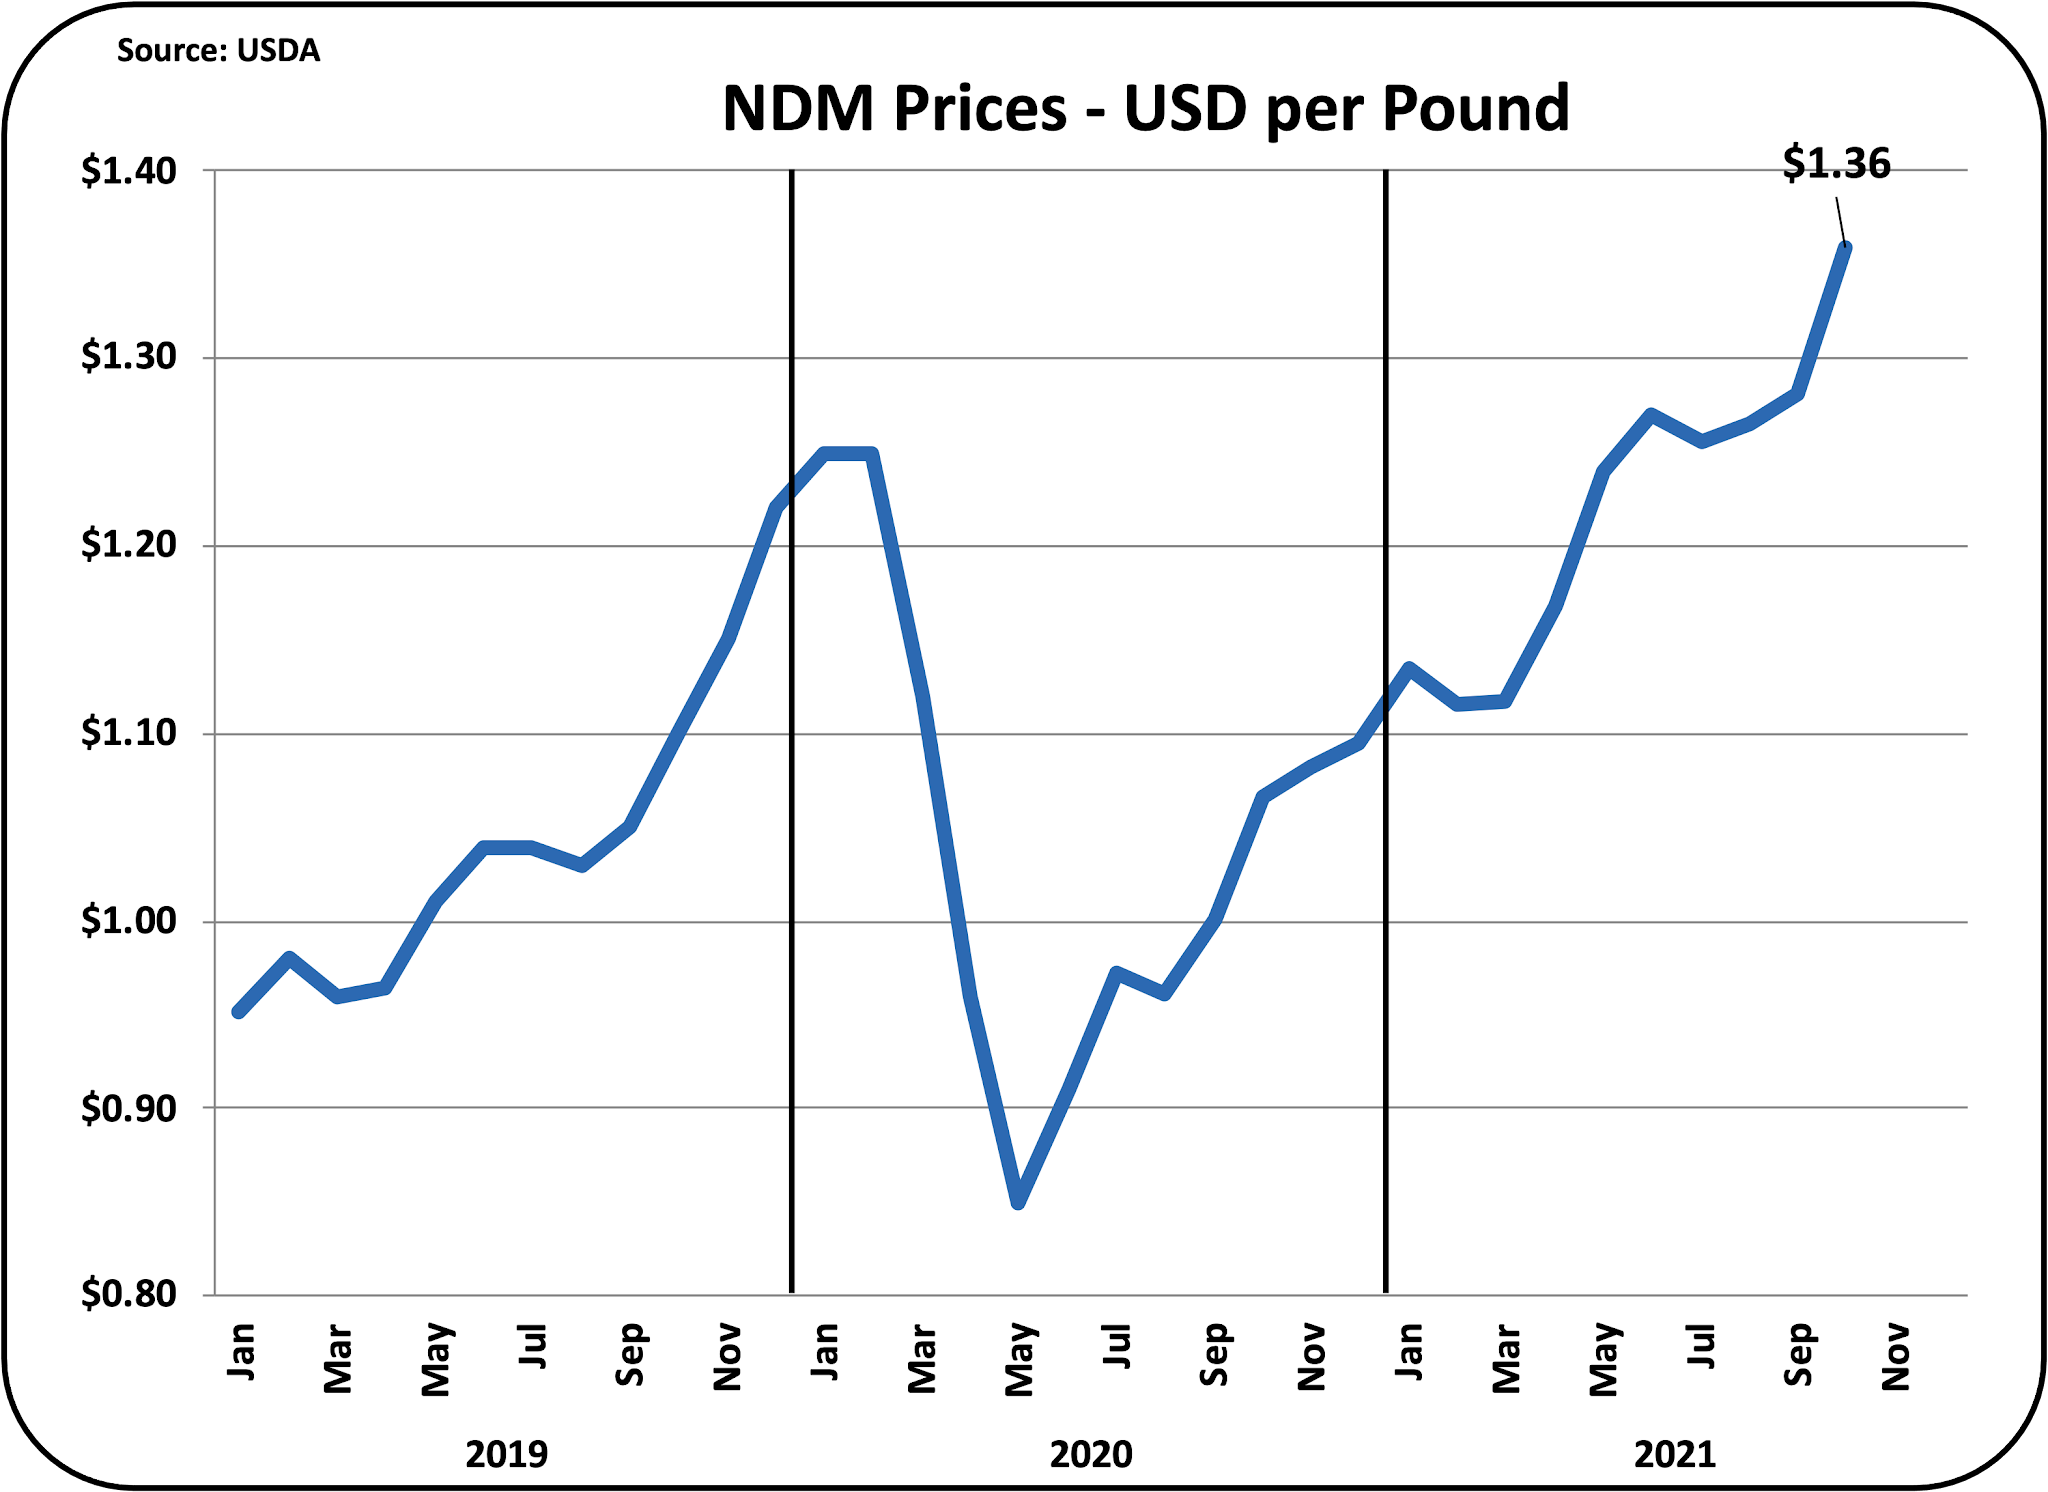 |
| Chart IX – NDM Prices used to Calculate Class IV Skim Prices |
So, the PPD is really driven by the comparative prices of cheese and NDM. However, there is one very big difference in the factors used to price cheese and NDM. Cheese pricing is driven by domestic events, like consumption, production, and inventories. NDM pricing is primarily an export item and is driven by global events. In a sense, NDM is a byproduct of butter production. It has to be priced to sell and is subject to global competition, exchange rates, political issues, and other global factors.



Be the first to comment