

Total grain rail cars loaded and billed dipped slightly in the second quarter of 2022 from 381,000 cars in quarter one to 373,000 cars in quarter two. This 8,000-car difference is half the decline from quarter two 2021, a year ago, when 391,000 grain cars were loaded and billed across all carriers. In other words, railways loaded and billed fewer grain cars than last quarter and this time last year. BNSF and UP, railroads that processed 64% of all grain rail cars in quarter two 2022, shipped 9% and 14% fewer grain rail cars than the same period last year, respectively.
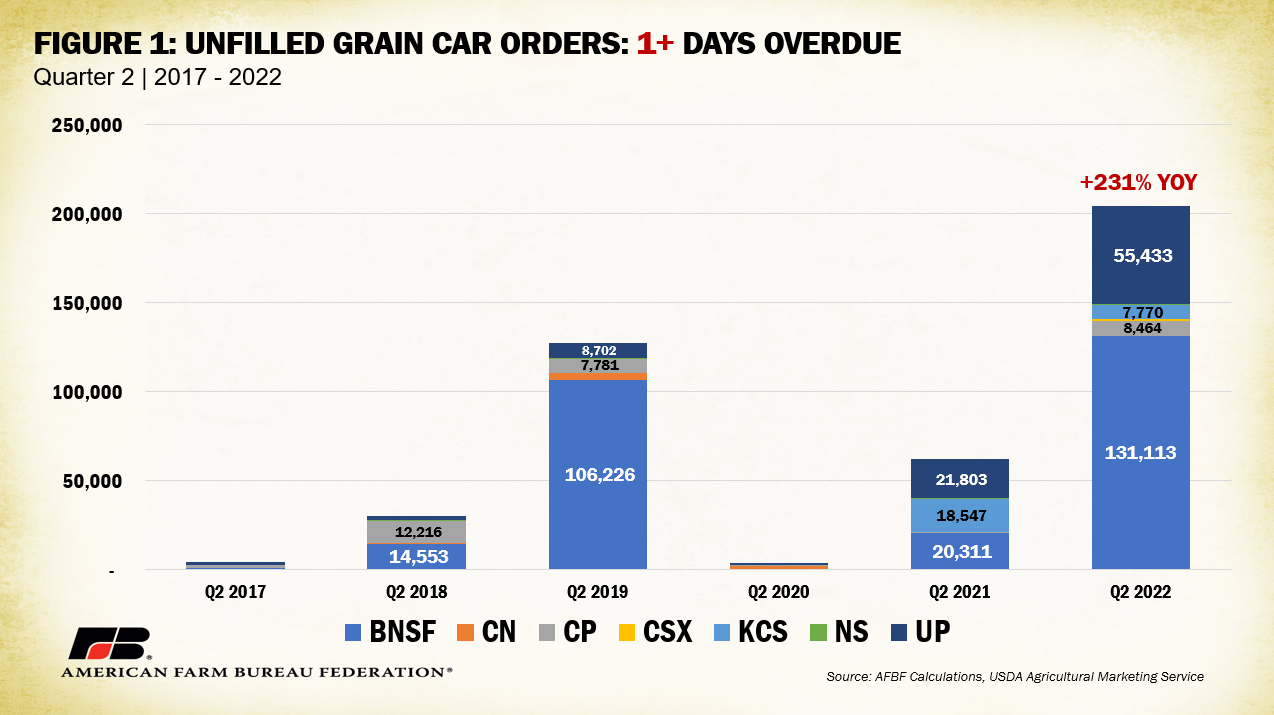
A look at unfilled grain car orders, a metric that tracks grain cars not effectively loaded and billed, reveals these declines are not due to reduced demand from shippers. As a reminder, each railroad reports its definition of “unfilled order” slightly differently but generally it is the number of cars a shipper (such as a grain elevator) ordered but did not receive. For example, if a grain elevator ordered 10 cars from a railroad and received seven, that would leave three unfilled orders. Figure 1 displays the number of grain car orders in the second quarter from 2018 to 2022 that were one or more days overdue. Between the second quarter of 2021 and second quarter of 2022, the number of these unfilled orders jumped from 62,000 to 204,000 – a 231% increase. Year-over-year, BNSF saw a jump of over 110,000 unfilled orders (+546%) and UP saw an increase of 33,000 (+154%). Comparing quarter one, 2022 and quarter two 2022, there has been a 49% (66,000 car) increase in unfilled grain car orders one or more days overdue, which highlights conditions have not improved for shippers since our first quarter analysis.
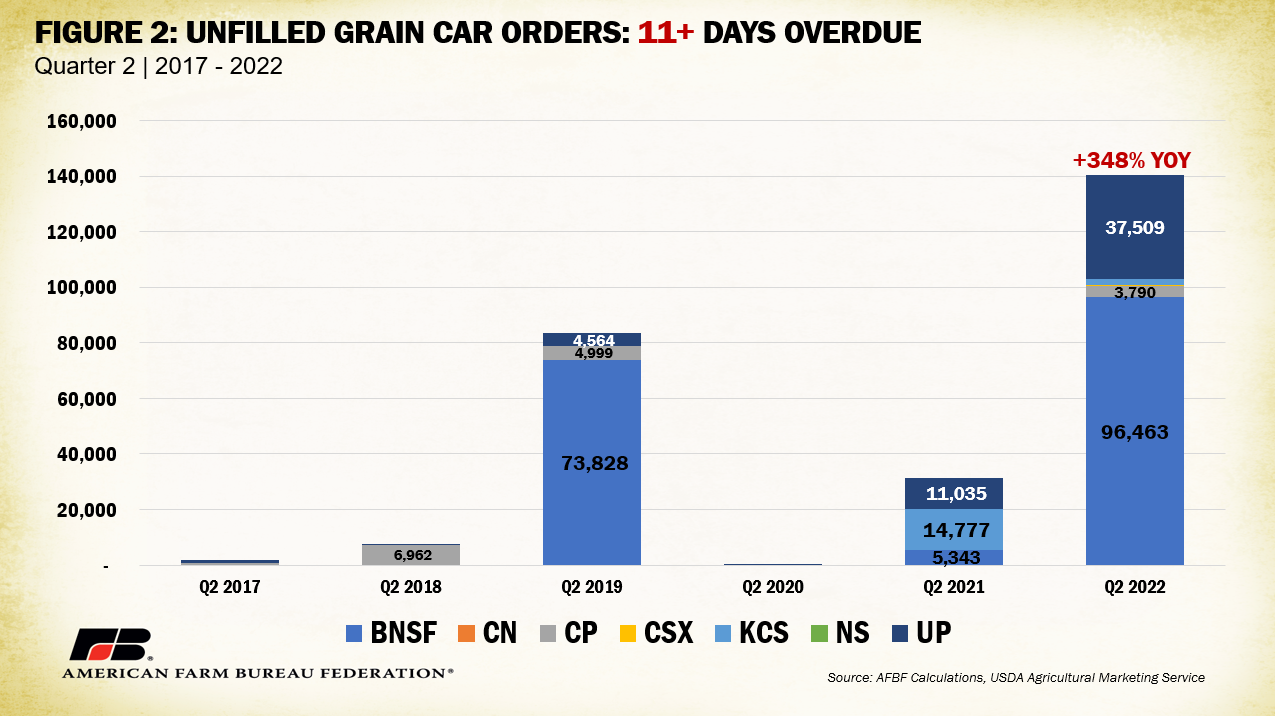
Of these 204,000 unfilled grain car orders one or more days overdue, nearly 70% or 140,000 were also 11 or more days overdue – a 348% increase from the second quarter last year and 82% increase from last quarter. Year-over-year, BNSF saw a jump of over 91,000 unfilled orders 11 or more days overdue (+1,705%) and UP saw 26,000 (+240%). Most order delays are lasting 11 days or more, putting perishable goods waiting for shipment at risk of rot and grain mills or livestock operations reliant on a steady stream of raw materials and feed in limbo. As expected, the bulk of unfilled grain car orders have been concentrated in grain-heavy regions of the Upper Midwest and Central Plains with North Dakota, Minnesota, Nebraska and Kansas all having over 20,000 unfilled orders in quarter two 2022.
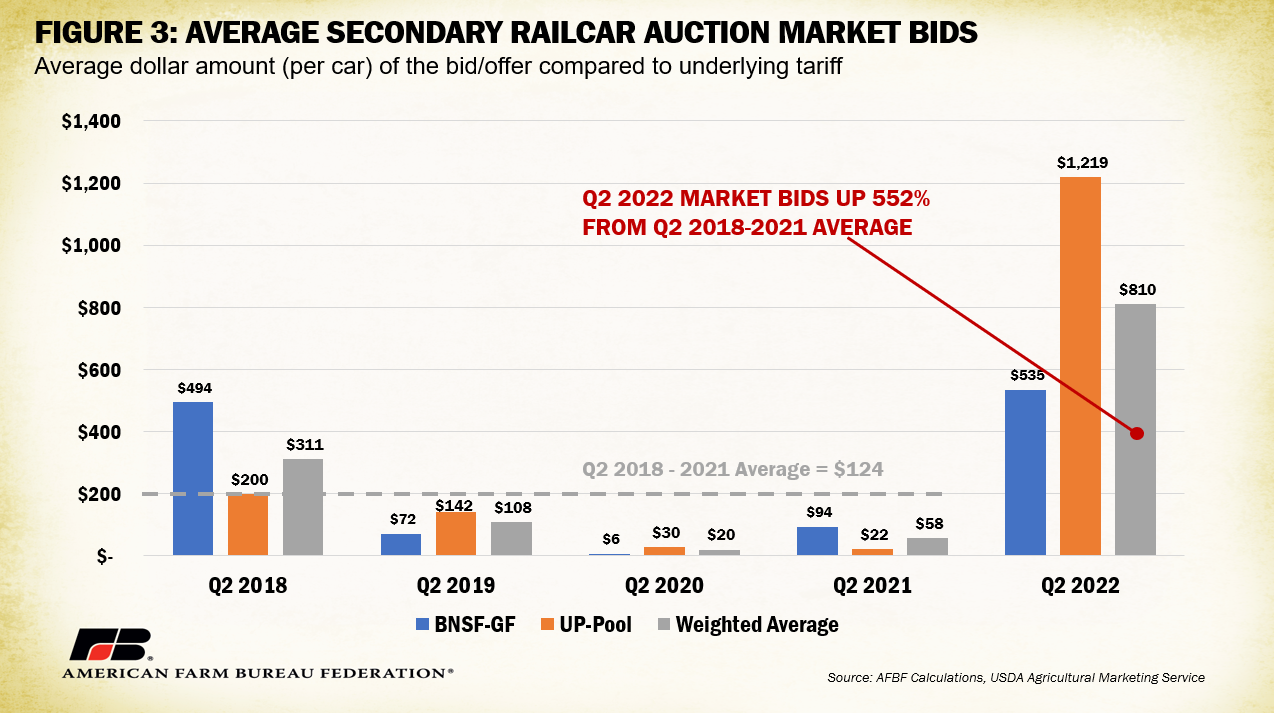
One area that further reveals the impacts of unfilled orders on shippers is the secondary rail market where shippers bid against each other for service contracts that could increase the chance of getting delayed product successfully moved. Last quarter, bidders faced a near 500% increase in secondary railcar auction bids from the prior four-year average (between BNSF and UP). This quarter, bidders faced even higher auction offers – up 552% from the prior quarter two four-year average (from $124 to $801). Figure 3 displays these quarter two comparisons, highlighting the magnitude of demand that remains within secondary railcar markets. Continued inflated rates in these auctions act as proxy for railway efficiency when shippers are forced to bid for a shrinking number of successfully loaded and billed contracts, as reflected in heightened unfilled order metrics.
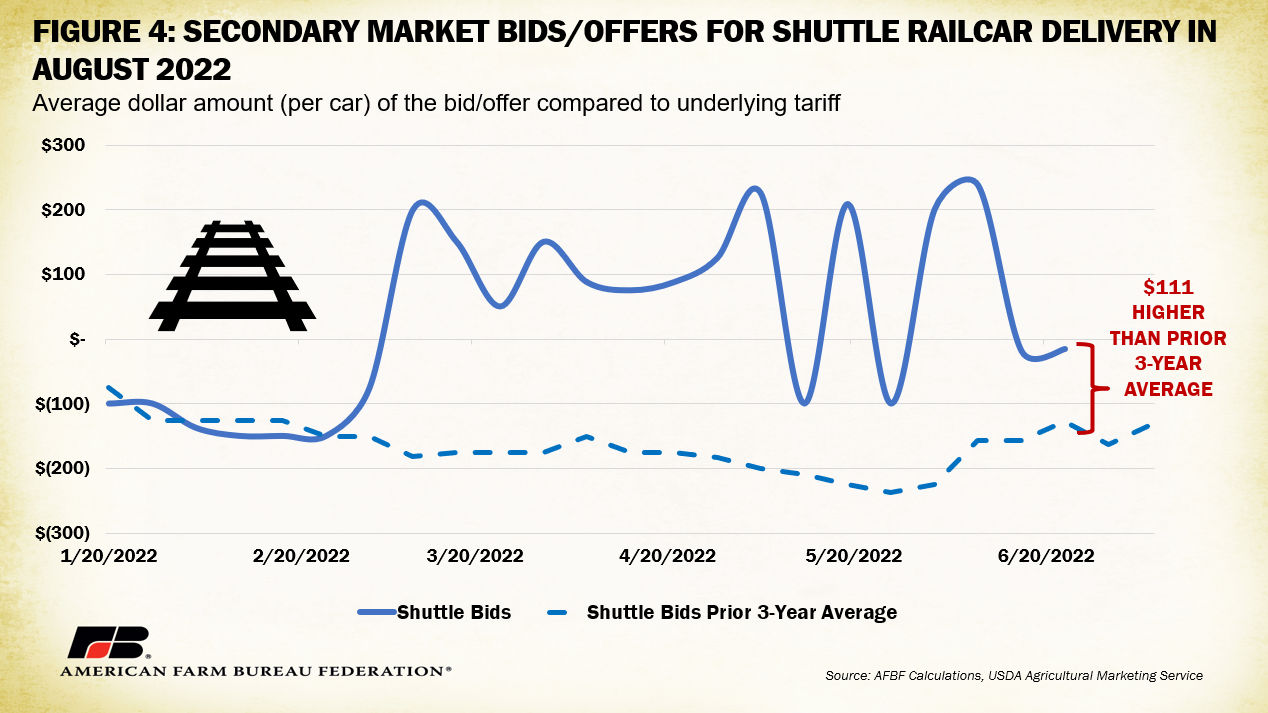
On a marginally higher note, secondary market bids for shuttle service have cooled for deliveries to be made in August from highs for deliveries made in April. Figure 4 shows for the week ending June 24 that bids/offers were $111 higher than the prior three-year average for August shuttle car deliveries and below the underlying contract tariff (as reflected in a negative value). This is a much slimmer margin than the $2,535 difference previously analyzed for April contracts – although rates remain volatile and well above average. Shippers with flexibility in moving product, especially those with non-perishable goods, may participate into the secondary market to take advantage of high bids for existing contracts, further contributing to delivery uncertainty.
Considering other service quality metrics, rail speeds continue to decline, with the average speed of grain and ethanol lower than other goods. As part of their submission to the Surface Transportation Board, railroads provide data on the average speed of their trains (in miles per hour), broken out by commodity/type such as automotive, coal, crude oil, ethanol, grain, intermodal, manifest, etc. In early 2020 when the COVID-19 pandemic initially dropped demand for goods, rail speeds reached 26 mph for all goods and 25 mph for grains and ethanol –
Many of the reasons for service and quality disruptions discussed in previous Market Intels remain relevant. Low container and equipment inventories have stalled operational capacity across all segments of the transportation system. More recently, discussion of the availability container chassis, the trailer frames specifically designed to carry a range of container types over railways and highways, has reached center stage. Even if a surplus of containers existed, chassis are essential to transport them. Chassis are also limiting the ocean port side of the equation where turnover of chassis between customers has been slowed to a pinch point. Further, the price for a chassis has reportedly tripled, from an average of about $7,000 to over $21,000 each.
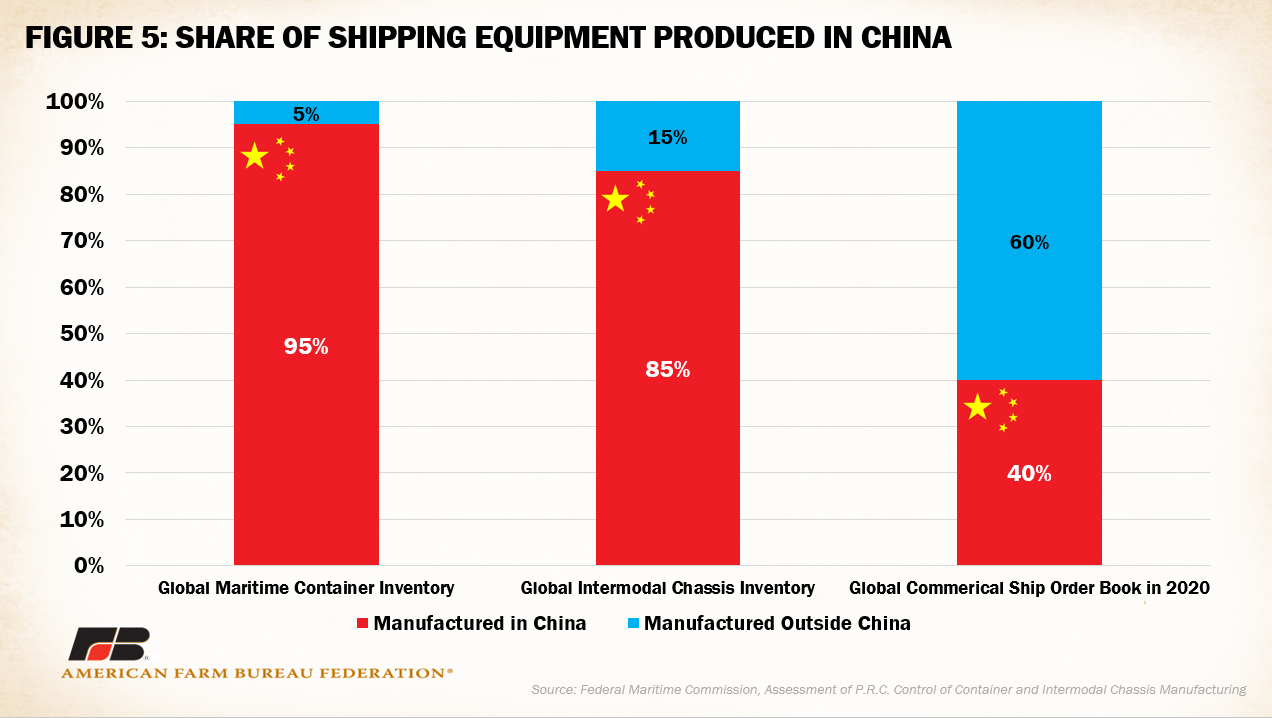
Currently, there are very few containers, container chassis and ships produced domestically, with the bulk of manufacturing taking place in China. Figure five displays the percentage of global inventory of chassis, containers and ship orders manufactured in China. According to the Federal Maritime Commission, a very small number of large Chinese firms control 95% of global maritime container inventory production, 85% of global intermodal chassis production and 40% of the global commercial ship order book. Relying on firms in a single foreign nation for production of equipment essential to the movement of goods such as food and fuel has its own national security implications in addition to general supply constraints.
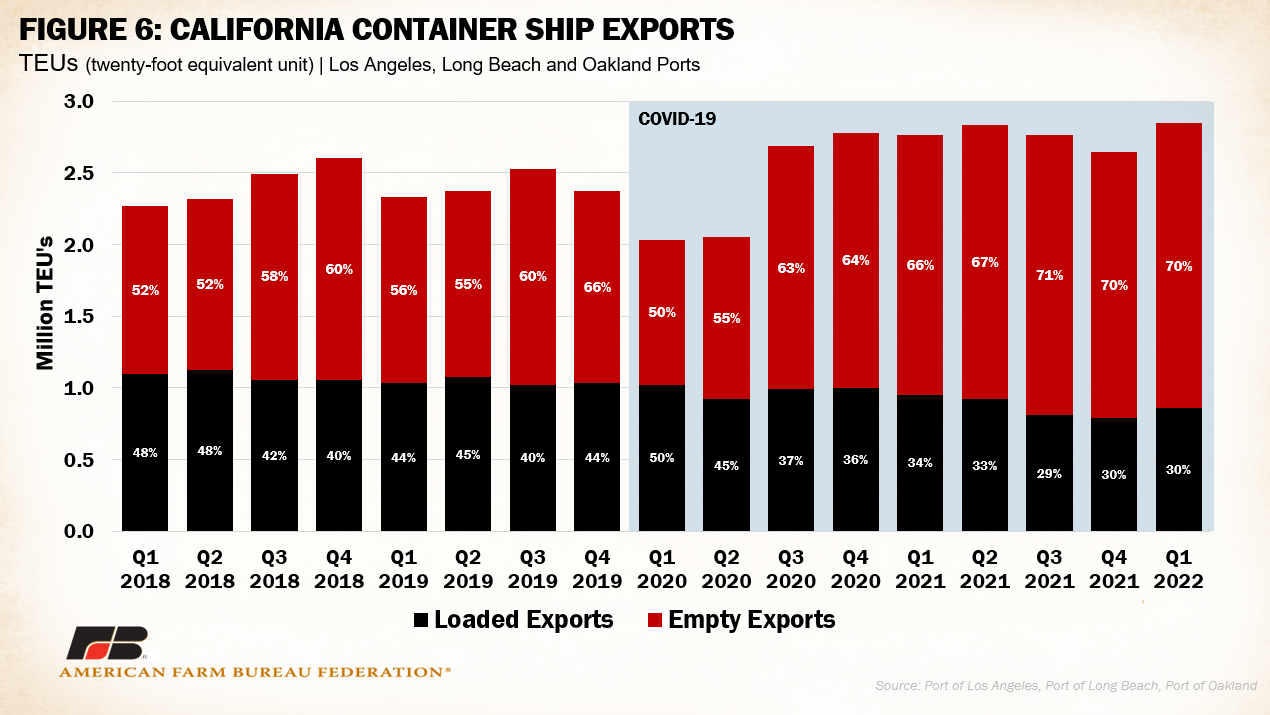
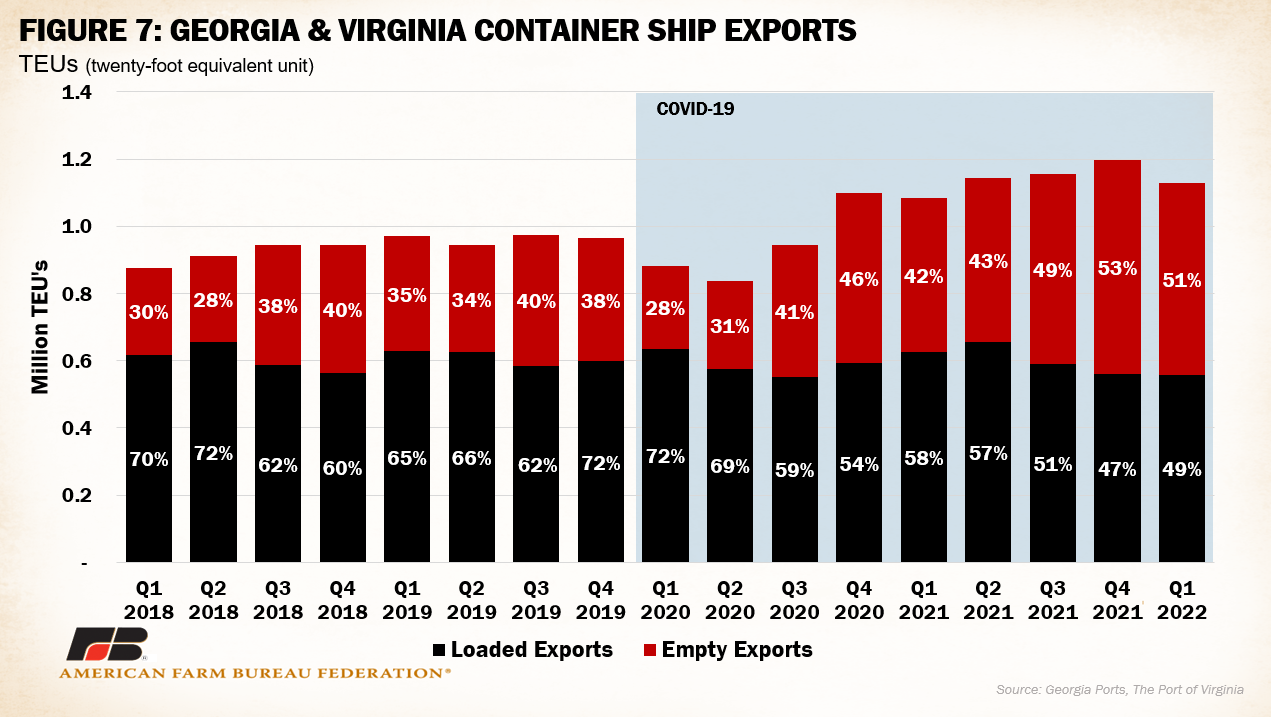
Speaking of the ocean freight network, large quantities of exports continue to move overseas without first being filled with U.S. product. Some ocean carriers consider it more efficient to ship empty containers rather than wait for export goods to be loaded, which has led to a significant decline in the number of containers available to agricultural exporters. Carriers are also incentivized to return containers abroad as soon as possible to take advantage of freight rates that remain much higher for routes from Asia to North America than North America to Asia. Figures six and seven illustrate the increased proportion of export containers that return empty from both West and East coast ports. In quarter one of 2022, 70% of exported containers from California were empty – the fifth consecutive quarter with empties over 65% of exports. At Georgia and Virginia ports, empty export containers remain at nearly 50% of export container volume – well above prior-year rates. Notably, as the volume of imports processed has increased under a period of high demand for international goods, that capacity has not been reflected in increases in loaded exports. Port operators and carriers have argued stacks of empty containers go unclaimed for extended periods of time – a possible result of compounding trucking delays.


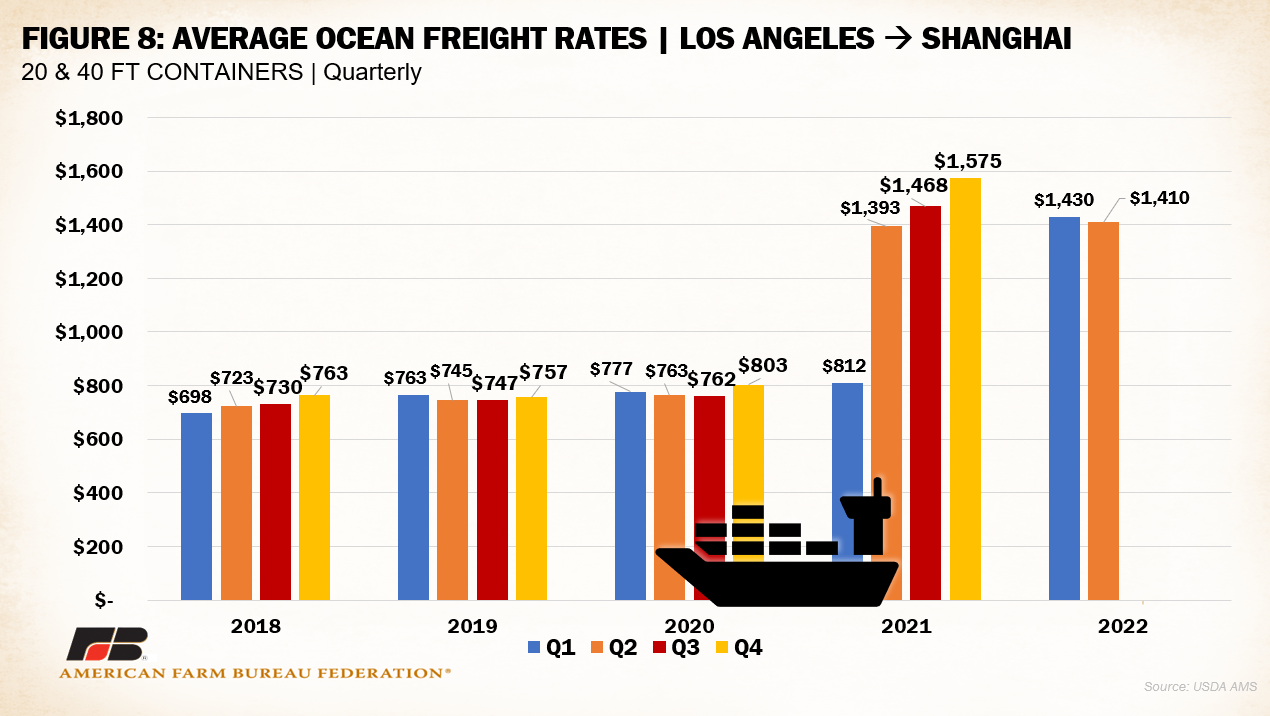
Ocean freight rates for U.S. exporters remains at heightened levels, further pressuring bottom lines for producers reliant on foreign markets for revenue. Figure 8 displays average ocean rates for 20- and 40- foot containers moving from Los Angeles to Shanghai, China. Rates hover around 75% above pre-pandemic levels with few signs of relief ahead. The compounding impact of widespread price increases for inputs like fertilizer and fuel combined with general inflationary pressures and record transportation costs continue to whittle away at margins.

Labor and crew availability continue to handicap all aspects of the economy. Uncertainty surrounding ongoing negotiations between the International
Conclusion
Disruptions present at each step of the supply chain intensify frustration for producers and customers alike. Both railways and ocean ports play an essential role in cost-effectively and reliably moving agricultural goods to their destination. Service disruptions, delays and heightened costs for shippers persist well into the second quarter of this year across ocean ports and railways. Legislation such as the Ocean Shipping Reform Act should assist in the much-needed movement of U.S. agricultural goods. New guidance released by the Federal Maritime Commission requires carrier invoices to report additional contract specifications related to detention and demurrage rules, applicable rates and “free time” which is the given amount of time for container pickup. This change, however, remains one small piece of a larger puzzle of possible creative solutions.


Be the first to comment