

Much of the present dairy news discusses gains and losses of the Class III milk price. The general conclusion is that they are “OK.” They are not as high as the peaks but are better than the prices in 2018 and 2019. Chart I below shows the history of Class III milk prices. They are currently around $16 per cwt.
 |
| Chart I – Class III Milk Prices Over 21 Years |
This post will cover some of the reasons why the second check is minimal or negative and, without change, will remain so in the future. Data in this post will be displayed for the last 21 years with trend lines that will reflect the long-term changes in the PPD. There are at least four factors that will keep the PPDs low or negative.
- The amount of Class I beverage milk, the highest paid milk, is decreasing as domestic consumption continues to fall.
- The price of NDM is used to price skim Class II and Class IV milk and partially price skim Class I milk. The value of NDM has decreased overtime as increasing amounts must be exported as there is not sufficient domestic demand. See this recent post for details.
- The May 2019 change in the Class I base milk price has put more emphasis on NDM. The price of NDM is now always included in the Class I calculation. Because the price of NDM is lower than it has been in the past, the Class I price is also lower.
- De-pooling from the Federal Orders has significantly increased as higher priced Class III milk is often removed from the pool to avoid negative PPDs. This leaves a lesser volume of milk to absorb negative PPDs and the size of negative PPDs will therefore increase for those remaining in the pool.
The Class I base price is used in this comparison because the Class I differentials are different in every Federal Order. The differentials stay the same overtime, so the chart below accurately expresses the long-term trend.
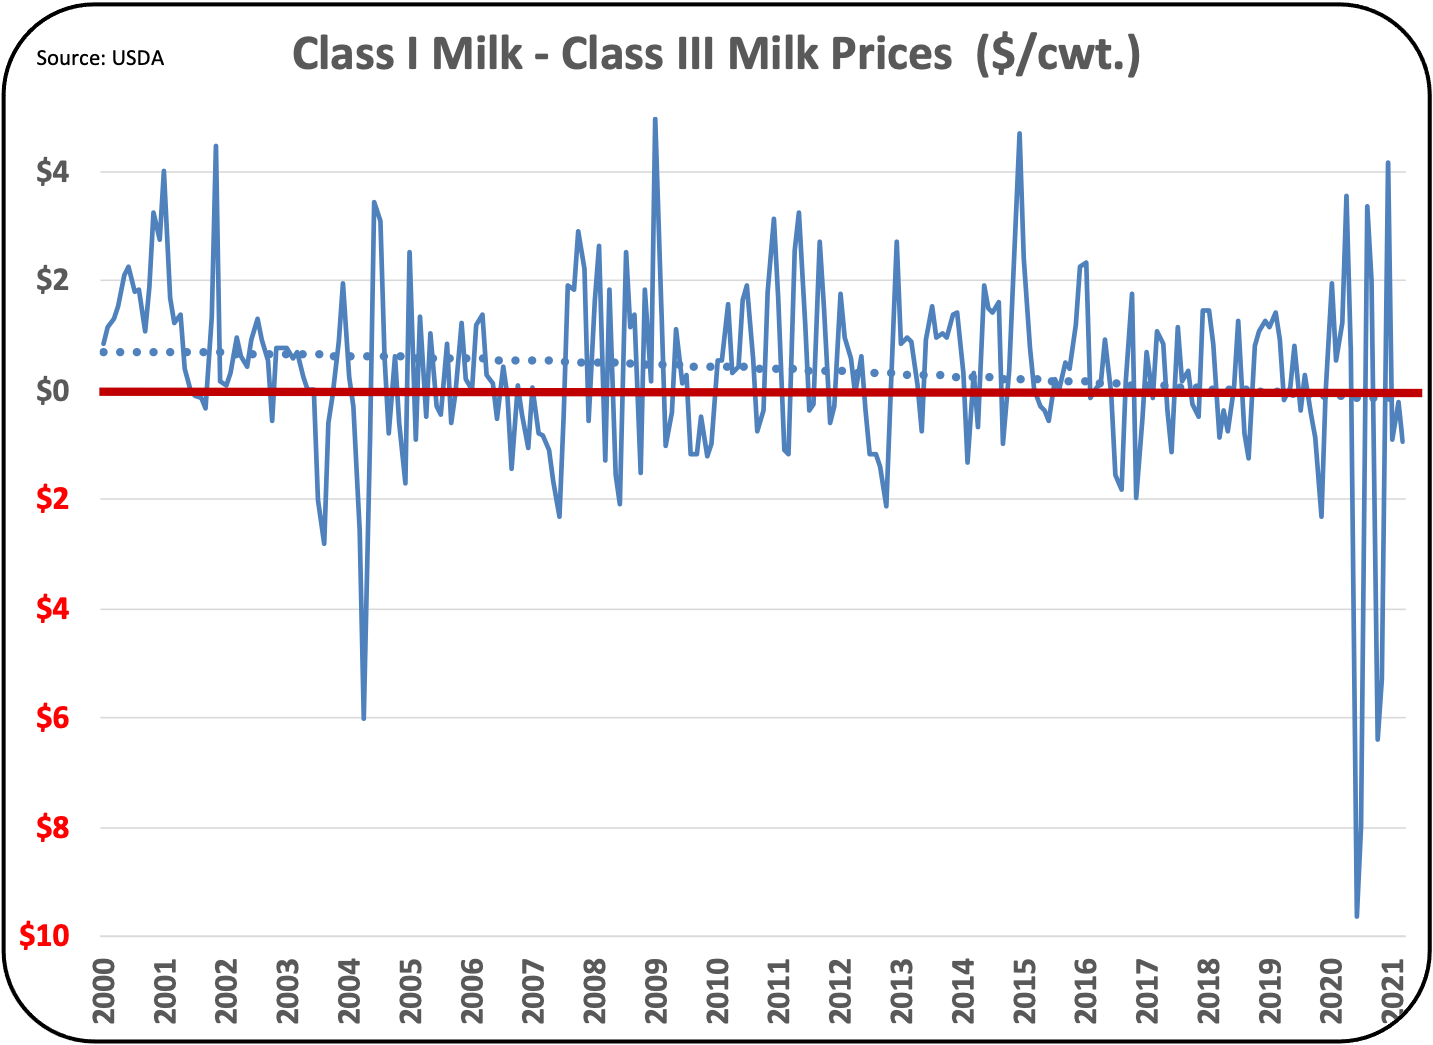 |
| Chart II – Class I Milk Price Minus the Class III Price |
Chart III shows the progression of each Class of milk over 21 years. Because Chart III is a chart with over 1000 data points, it is hard to discern differences and trends. For that reason, only the trend lines are shown in Chart IV. This analysis will focus on Chart IV.
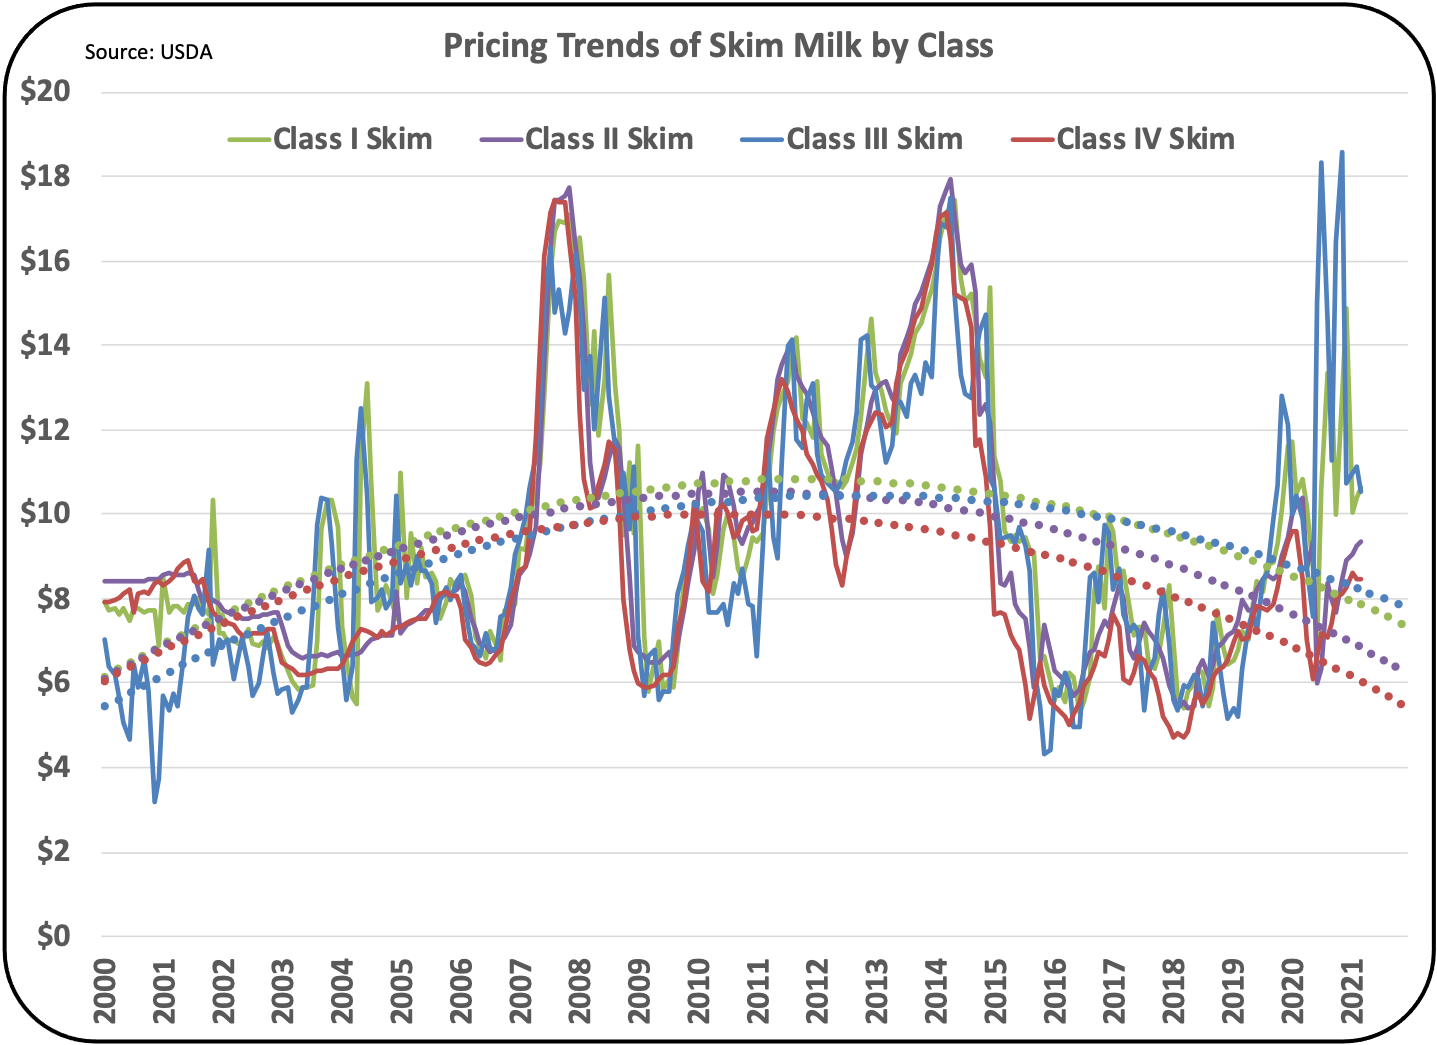 |
| Chart III – Milk Prices for each Class of Milk for 21 years |
In the early years of the Federal Order Pricing, Class IV skim milk (the red trend line below) was typically worth more than Class III skim milk (the blue line below). Therefore, Class I and Class II were based on Class IV prices and were worth more than Class III milk. Class III milk was the lowest paid milk. As a result, in the first three years of the new Federal Order pricing, PPDs were always 100 percent positive. But 21 years later, in 2020, Class III skim milk was worth more than any other Class of milk. As a result, from mid 2020 to the present, PPDs were mostly all negative.
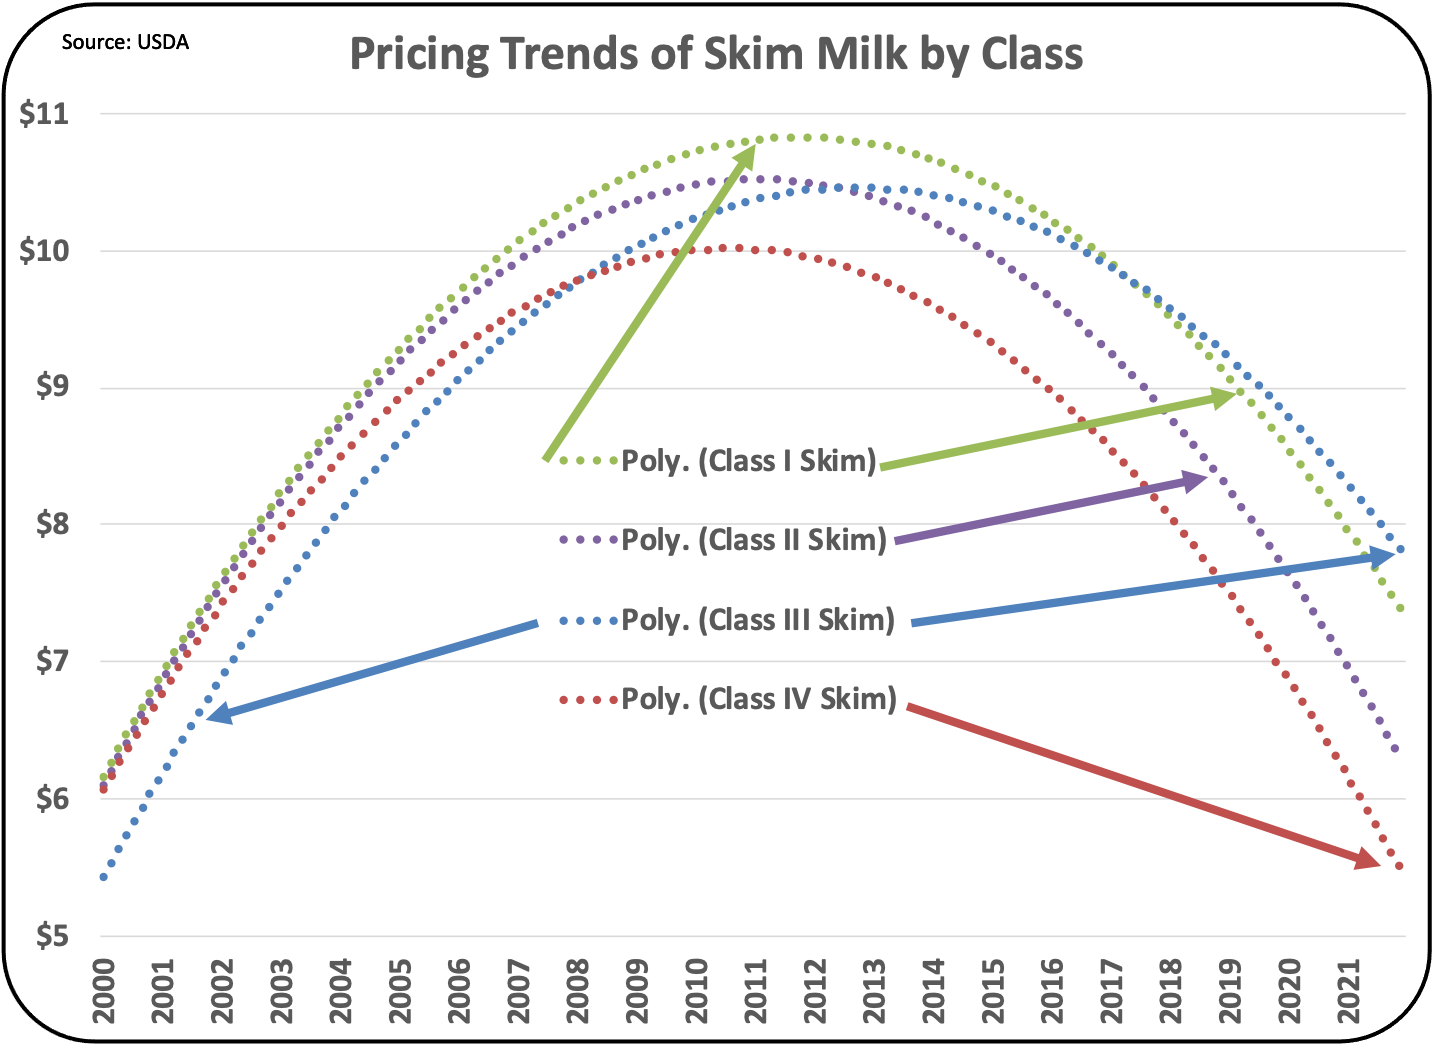 |
| Chart IV – Trend lines for each Class of Milk for 21 years |
 |
| Chart V – PPD of the Northeast Federal Order. |
 |
| Chart VI – PPD of the southwest Federal Order |
 |
| Chart VII – PPD of the Upper Midwest Federal Order |
 |
| Chart VIII – PPD oof the California Federal Order |
Below are two tables of the PPDs for the Federal Orders shown above. Table I lists the PPDs for the first 26 months beginning in the year 2000. There are no negative PPDs.
 |
| Table I – PPD for the First 26 Months |
 |
| Table II – PPDs for the Current 26 Months |
Payment in the Federal Orders is primarily based on the volume of butterfat and milk protein. The only way to maximize income and cash flow is to produce maximum butterfat and milk protein. Milk protein is the most valuable. The science exists to maximize these components. Every effort should be made to maximize butterfat and milk protein.


Be the first to comment