The prior post covered the production growth of milk, cows, cheese and butter. Cheese production is growing by 4.5% annually and butter production is growing by 5.9% annually.

Is domestic consumption growing at this rate? The U.S. population is growing by 0.5% annually. Can exports financially manage the increasing production that is above domestic needs? These issues will be covered in detail below.
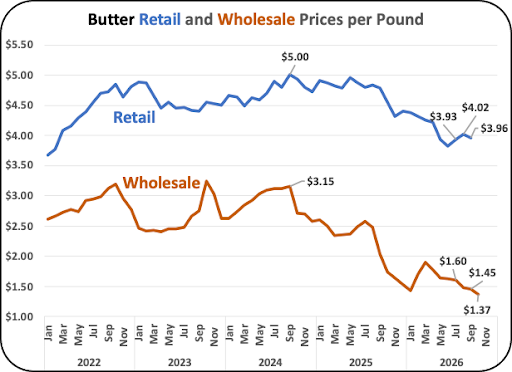
There are concerns that the excess dairy products in inventory will reduce component prices. The October 2026 price for butterfat is $1.38 per pound. That is the lowest price for butterfat since April 2020. The domestic disappearance of butter is static and exports are static.
Butterfat pricing is based on butter prices. About 45% of butterfat goes to cheese making, 20% goes to butter churning, and about 10% goes to fluid milk. The three products above in total account for 75% of milk. The remaining 25% include the many other dairy products.
CHEESE
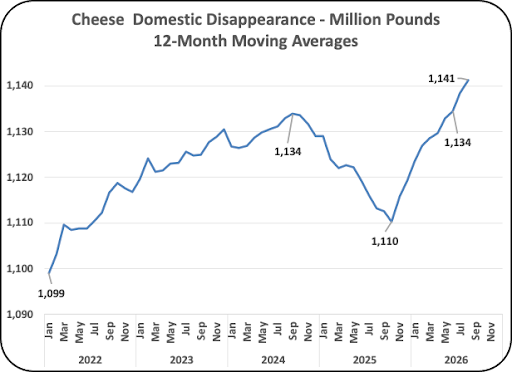
Chart I below tracks cheese domestic disappearance from inventory. There was a 2.5% increase in the last 12 months. The increase in domestic disappearance is continuing and is at record prices.

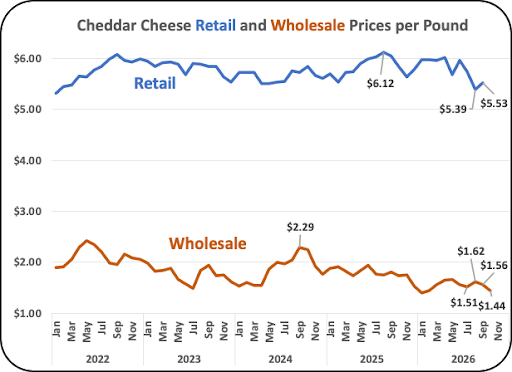
With higher inventories, prices typically fall. Lower retail prices should increase retail sales. As shown in Chart II, the retail cheese prices are not decreasing.
The wholesale prices have been decreasing over the six years in the chart while retail prices are steady. The spread between retail and wholesale prices (Chart II) has increased.

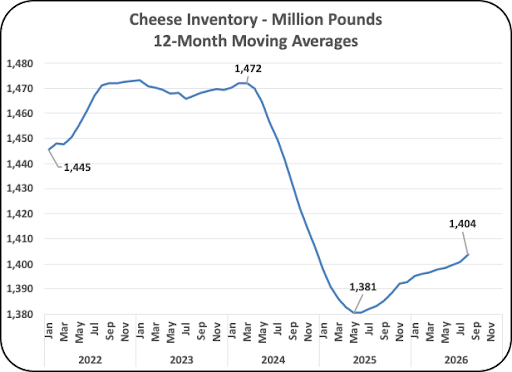
Cheese inventory was high after the COVID period. The inventories fell by 6% during the late 2024 and early 2025 period. The inventory is now increasing (Chart III).

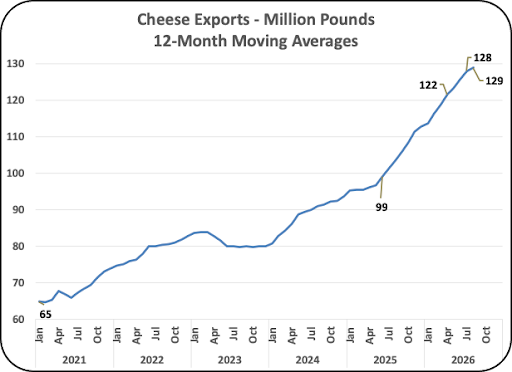
Chart IV follows the exports of cheese. Exports are increasing in the 12-month moving averages, but the month of August showed some slowing. A drop in exports could build inventories higher, which would lower cheese prices and the value of milk protein.

BUTTER
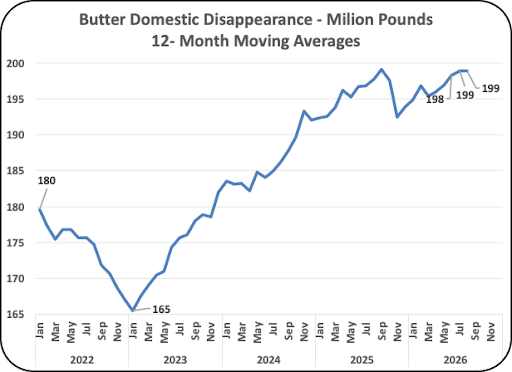
Butter domestic disappearance is flat (Chart V). There is no growth.

The retail and wholesale prices of butter are falling. The wholesale price of butter is dropping faster than the retail price which should allow for further declines in retail prices (Charts VI).
Butter prices are used to price butterfat.

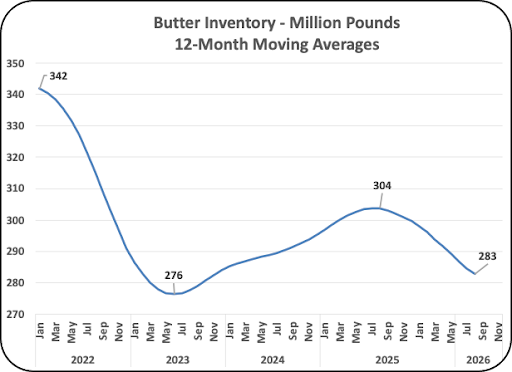
Butter inventories are now stable and at a reasonable level (Chart VII).

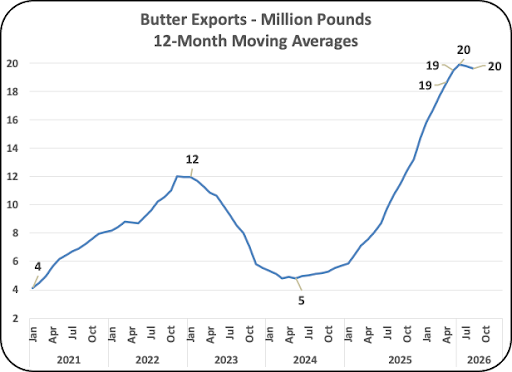
Butter exports began increasing in early 2025 and reached to a new high with a 400% increase. The increasing stopped in March 2026 and has now followed a static level of butter exports (Chart VIII). The slowdown started in March 2026 and is continuing.

SUMMARY
The data above is complex. The data on cheese shows some concern and it is the largest section of dairy milk usage. Production is continuing to increase as covered in the prior post. Domestic disappearance is continuing to grow. Export volumes are steady. Inventories are increasing at about the same percent as production is increasing. The cheese financial trends show that the U.S. retail cheese prices are steady while cheese wholesale price have decreased. There is no inflation in retail cheese prices.
Overall, the fast-moving changes in the dairy industry are proceeding smoothly with manageable inventories and strong exports. The revenue for dairy farmers is low, and if they can still manage their business with lower prices, then the changes are certainly an improvement to supply quality products to the U.S. and the world.
As mentioned above, butterfat values are very low. October 2026 butterfat prices just announced are $1.38 per pound, a price not seen since 2020. Protein prices are average but could fall with the trends to lower cheese prices.
Will the expansion of cheese production pay off?


Be the first to comment