
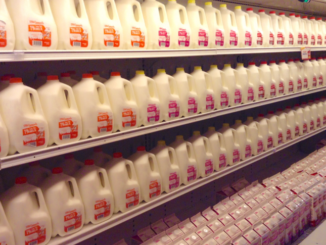
Fluid milk is perishable and requires refrigeration. It cannot be frozen or economically stored for long periods of time. Therefore, the link between production of fluid milk and consumption is firm and tightly linked. What is produced must be sold within a very limited time.
Chart I below shows the monthly production of Class I milk. For years per capita consumption has been declining, but population growth has keep the Class I milk category stable. But, starting in 2017, the total Class I milk category started a decline. As we get more data on the decline, it becomes obvious that the decline is accelerating. The trend line in Chart I was extended through 2019. By the end of 2019, Class I milk will be down to about 3000 million pounds per year by this analysis. Compared to 2016, that would represent a 13 percent drop. Declines typically shrink in pounds as they reach a new plateau. The decline in dairy milk is not following that pattern. Its volume decline is increasing with time.
 |
|
Chart I – Class I Milk per Month |
Class I milk is always the highest paid milk. The FMMO formulas are designed to assure this pricing structure. The “Uniform” milk price is the weighted average of the four calculated milk classifications. Producers are essentially paid by the “Uniform” price through procedures such as the Producer Price Differential. As less Class I milk is produced, the “Uniform” producer price will therefore decline. Chart II below shows the reduction in the percentage of Class I milk in the total producer milk. The trend line shows a decline from around 33% of Class I milk in the mix to a level around 28% by the end of 2019.
Unless something changes, the decline will continue and Class I milk will have a reduced impact on the “Uniform” price and, all other things equal”, the “Uniform” price will decline.
 |
|
Chart II – Class I Milk as a percent of Total Milk |
Chart III is the most important change. It shows the increasing rate of volume decline. In 2016, Class I was not increasing or decreasing. By year-end 2017, it was decreasing by more than one percent per year. By year-end 2018, the volume of Class I milk will be decreasing by about three percent per year. If the trends continue, by year-end 2019, the rate of decline will be about 6 percent per year. These numbers are lower than those calculated by the using consumer consumption data in an earlier post. However, both sets of data do show a rapidly increasing reduction in Class I milk.
 |
|
Chart III – Class I Milk Reduction from Prior Year |
The decline in drinking milk appears to be the start of a long-term trend and the depth of the trend is growing. It has to be faced directly and plans made to insure the financial future of the dairy industry with less Class I milk.
Editor’s Note: John Geuss is a dairy consultant based in Florida. This information appears in his Milk Price blog column sponsored by Addiseo and is published here with permission. He may be contacted at johngeuss@gmail.com

Be the first to comment