

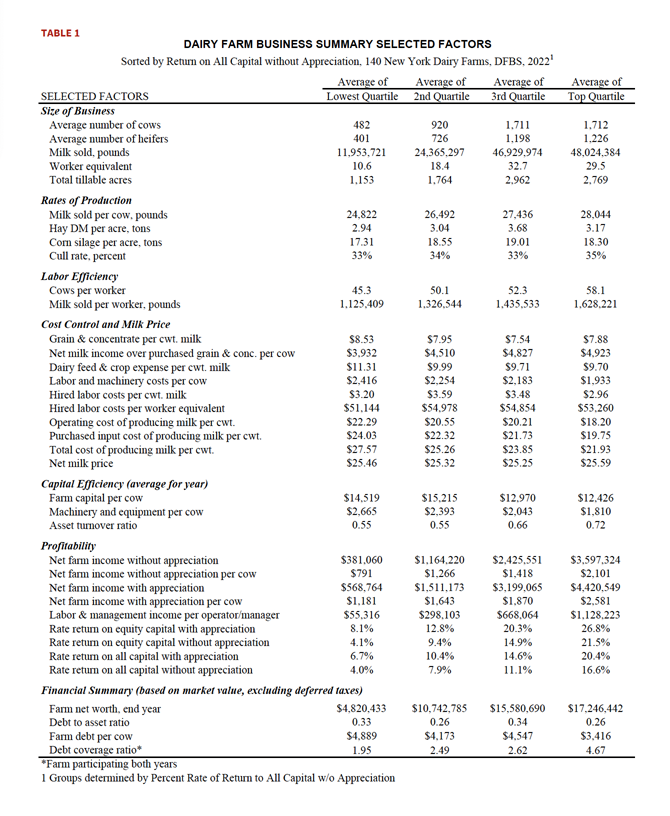
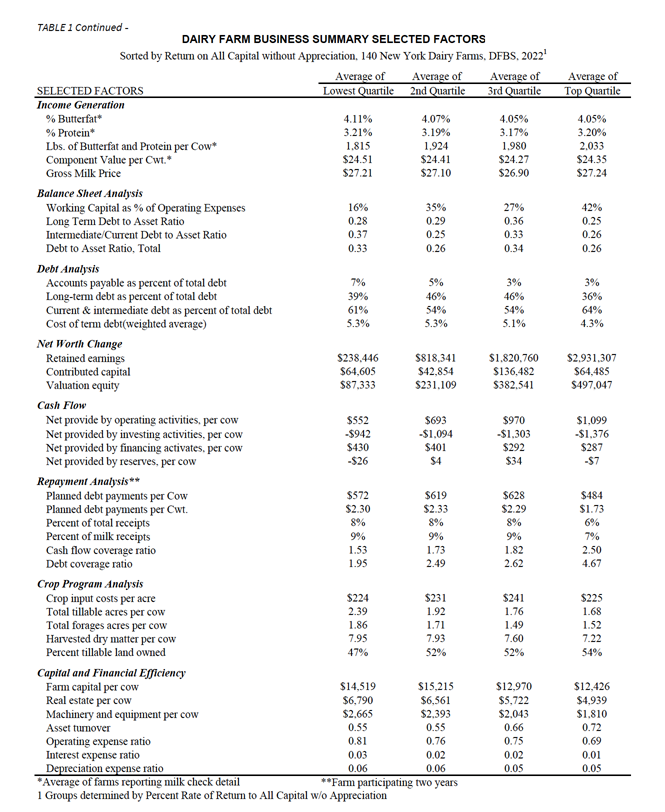
With a total of 140 New York dairies completing the DFBS in 2022, farms were sorted into four groups representing earnings quartiles, using the rate of return on all assets without appreciation (ROA) to measure earnings. Each quartile represents 35 farms. The average ROA was four percent for the lowest quartile, 7.9 percent for the second quartile, 11.1 percent for the third quartile, and 16.6 percent for the highest quartile. The following tables present selected farm characteristics, costs, and performance measures associated with each quartile to identify similarities and differences across the four groups. Table 1 highlights selected measures of size, efficiency, costs, and profitability for each earnings quartile.
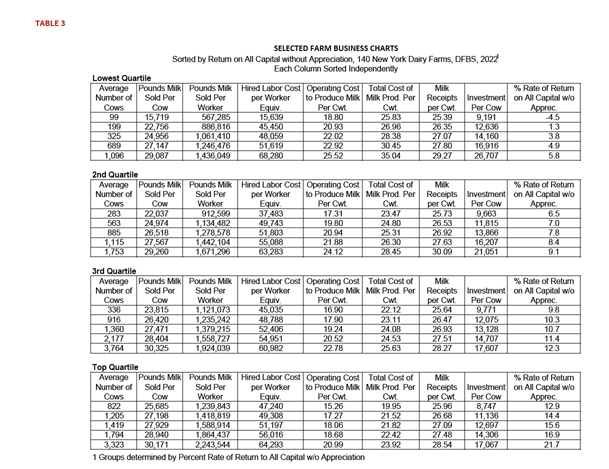
Herd size tends to increase as farm profitability rises, and there was a positive correlation between herd size and earnings in 2022. As in past years, the lowest earnings quartile reported the smallest average herd size, 482 cows. The average herd size for the top two quartiles was almost the same. Farms in the third quartile had an average herd size of 1,711 cows, compared to 1,712 cows for the top quartile. Larger farms were not always more profitable, however, and each earnings quartile contained a range of herd sizes that overlapped with other quartiles. Table 3 presents a quintile range for herd size and other selected measures within each of the four earnings quartiles. The quintile range in herd size for the lowest earning farms was 99 to 1,096 cows. The highest earning farms had a quintile range in herd size from 822 to 3,323 cows, which was a narrower range compared to farms in the third earnings quartile. The quintile range is the average of farms by 20 percent increments for that measure. In Table 3, each quintile represents seven farms.
As herd size increases, dairy farms tend to utilize more labor and land. In 2022, the average number of worker equivalents increased from 10.6 for the lowest earnings quartile to 29.5 for the highest.3 The lowest quartile of farms reported an average of 1,153 tillable acres, compared to 2,796 for the highest earnings quartile. However, farms in the third earnings quartile used the most labor and land, on average, with 32.7 worker equivalents and 2,962 tillable acres.
Typically, herd size is also positively correlated with labor and land efficiencies. Farms in the lowest earnings quartile reported the lowest labor efficiency levels, with 1.13 million pounds of milk sold per worker, compared to 1.63 million pounds per worker for farms in the highest earnings quartile. There was little variation in the average hired labor cost per worker equivalent across earnings quartiles. Farms in the second quartile spent the most, on average, with a hired labor cost of $54,978 per worker, just 7.6 percent more than farms in the lowest earnings quartile with the lowest average hired labor cost per worker. Variation within each quartile was greater. Farms in the highest earnings quartile had a quintile range in hired labor cost per worker equivalent from $47,240 to $64,293, a difference of 36.1 percent. Better labor efficiency among farms in the top quartile contributed to an average hired labor cost of $2.96 per cwt., the lowest among the four groups. Despite the similarity in average herd size, farms in the third quartile utilized labor less efficiently and spent an average of $0.52 more per cwt on hired labor compared to farms in the top earnings quartile.
Farms in the two highest earnings quartiles worked the most acres overall, yet farms in the lowest quartile cropped more acres per cow, and reported the highest crop revenue per cow, compared to the other groups. Average tillable crop acres dropped from 2.39 acres per cow for the lowest quartile of farms to 1.68 acres per cow for the highest quartile of farms. Utilizing fewer acres per cow contributed to lower capital investment per cow for farms in the highest quartile, with an average machinery and equipment investment of $1,810 per cow and an average total capital investment of $12,426 per cow.
In 2022, the highest quartile of farms produced an average of 28,044 pounds of milk per cow, more than any other group, and 3,222 more pounds per cow than the lowest quartile. However, high producing farms are not always high profit farms. Table 3 shows more variation in pounds of milk sold per cow within each earnings quartile. The lowest earning farms had a quintile range in milk pounds per cow from 15,719 to 29,087, while farms in the highest quartile ranged from 25,685 to 30,171. Cull rates showed little variation across earnings quartiles, with an average annual cull rate of 35 percent for the highest earnings quartile versus 33 percent for the lowest. There was more variation in the ratio of heifers to cows, with farms in the top quartile averaging 72 percent heifers to cows, compared to 83 percent heifers to cows for the lowest quartile.
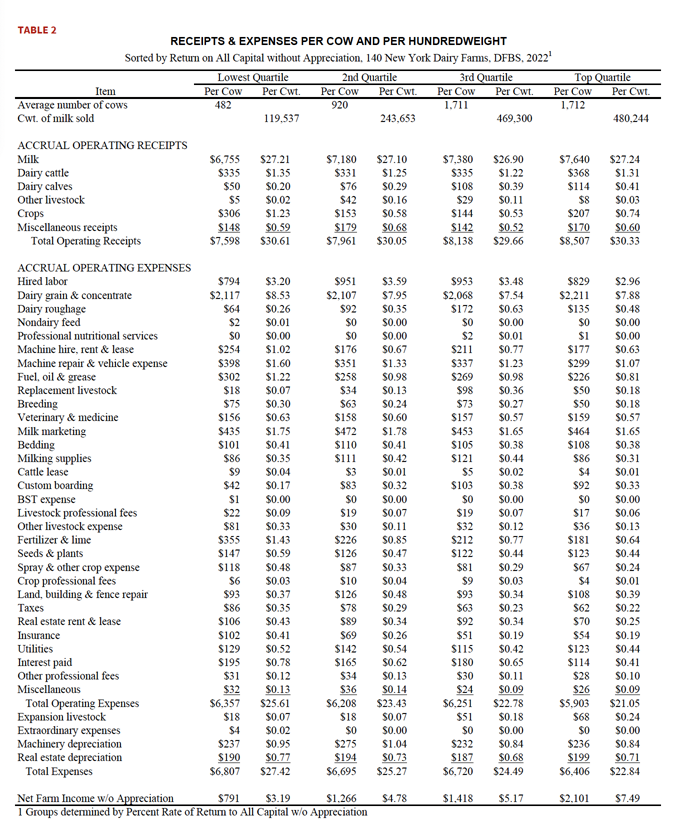
The average total farm operating cost dropped from $25.61 per cwt. for farms in the lowest earnings quartile to $21.05 per cwt. for farms in the highest quartile, a difference of $4.56 per cwt. (Table 2). With expenses divided into 31 categories, differences can be highlighted across the four groups. The highest quartile of farms had the lowest average cost per cwt. in 23 of 31 expense categories, and the lowest average cost per cow in 14 of 31 categories, including machinery repair, fuel, fertilizer, crop chemicals, land rent, and property taxes. Lower costs in these expense categories may be driven by utilizing fewer acres per cow and achieving higher levels of asset utilization. However, cropping fewer acres per cow may drive up purchased feed costs. Farms in the highest earnings quartile spent an average of $2,211 per cow on purchased grain, more than any other group, and they had the second highest average purchased forage cost per cow.
The highest quartile of farms averaged the highest milk sales, cattle sales, and calf sales per cow. They achieved the second highest average crop revenue per cow, despite having the fewest crop acres per cow. The combined impact of all revenue sources resulted in average total operating receipts of $8,507 per cow, higher than all other groups. Farms in the highest earnings quartile also reported the lowest average farm operating expense per cow. Including expansion livestock and depreciation expenses, total expenses for farms in the highest quartile averaged $6,406 per cow, about $400 less per cow than farms in the lowest quartile. As a result, the highest quartile of farms generated an average net farm income of $2,101 per cow, compared to $791 per cow for the lowest quartile.
The average operating cost to produce milk fell from $22.29 per cwt. for the lowest quartile of farms to $18.20 per cwt. for the highest quartile, a difference of $4.09 per cwt. This pattern resulted from the highest quartile of farms having the lowest total cost of production per cow and the highest milk output per cow. Notably, the difference across earnings quartiles in the average cost of production was much greater than the difference in average milk price. Average gross milk sales ranged from a low of $26.90 per cwt. for the third earnings quintile to a high of $27.24 per cwt. for the top quintile, a difference of $0.34 per cwt. After incorporating costs associated with depreciation, family labor and management contributions, and a fve percent return on owner equity, the total economic cost of producing milk averaged $27.57 per cwt. for the lowest quartile of farms and $21.93 per cwt. for the highest quartile, a difference of $5.64 per cwt.
Analyzing how businesses compare to industry benchmarks can be useful to identify areas within the business that could benefit from further evaluation and possible management changes. To participate in the Dairy Farm Business Summary and Analysis Program visit our website for more information: cals.cornell.edu/pro-dairy/our-expertise/business/dfbs

Be the first to comment