
Milk component yield has become a key management focus for dairy farms over the last two decades. The combination of the impact that components have on milk pricing and two-tier milk pricing programs have been driving this focus.
Pounds of components refers to the combined sum of butterfat and protein shipped per cow per day. It is a product of a farm’s butterfat and protein percentage in their milk, as well as total pounds produced per cow per day. Strategies to increase efficiency and herd component yield differ from farm to farm. Today, some farms aim to ship more fluid pounds overall to push component pounds higher. However, for farms that cannot ship more fluid milk, they are pursuing other strategies that might improve butterfat and protein percentages.
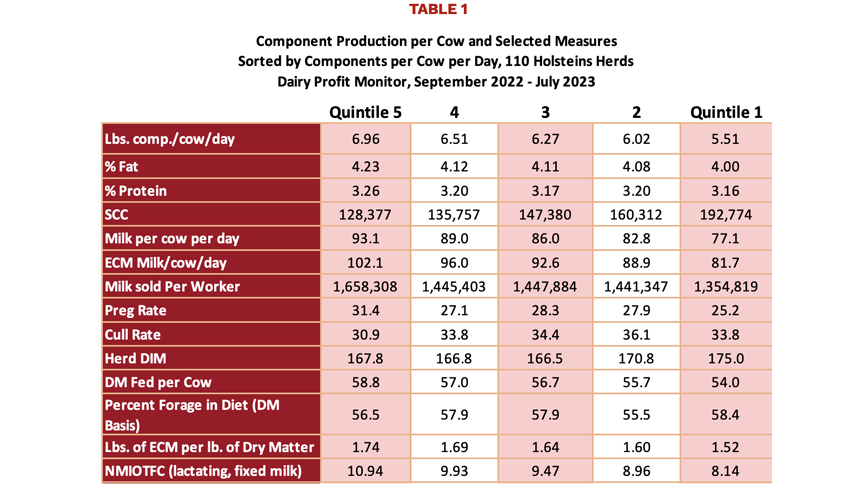
Using data from the Dairy Profit Monitor for the period of August 2022 to September 2023, herd performance metrics over 12-months from 110 farms were used to create five performance groups with 22 farms in each quintile. The pounds of components per cow per day were used to sort herd performance measures, with the highest quintile of data being the highest component herds. With the focus on pounds of components, these farms were strictly Holstein herds to eliminate outliers due to breed. The average pounds of components per cow per day and selected measures by quintile are in Table 1. Quartile 5 represents the highest performance group in pounds of components, while Quartile 1 represents the lowest of the range.
The average pounds of components per cow per day for the lowest quintile was 5.51, 6.02 for the second quintile, 6.27 in the third quintile, 6.51 in the fourth quintile, and 6.96 in the top quintile. The highest component herds had the highest percent fat and protein, lowest somatic cell, and were the highest for milk yield. In other areas, these same herds had the highest pregnancy rate at 31 percent, while the lowest component herds had the lowest pregnancy rate at 25 percent. Cull rate and days in milk did not have a clear trend, though the highest quintile for components had the lowest cull rate at 31 percent.
The same relationship is seen with net milk income over total feed cost. Higher component producing herds had higher net milk income over total feed costs and this trend can be seen as components increases across groups. The group lowest in components saw an average net milk income over total feed cost of $8.14, the second quintile was $8.96, the third was $9.47, the fourth was $9.93, and the top component herds had an average of $10.94 net milk income over feed cost. Some relationships can be seen between factors of production and herd component production.
Selected data for each performance group from Table 1 was further broken down to look at the range of values within each component group, found in Table 2. For each group, data was first sorted in descending order for each metric, followed by calculating averages by quartile of data within those same 22 farms. With this approach, each column of data is independent from others. Looking at the expanded data allows for further examination of relationships between herd management areas and component production.
There are some metrics for which ranges in lower quintiles overlap or are like those in higher component groups. This is the case in some instances for percent butterfat and protein. Though some of these herds are higher in fat and protein on average percentage wise, the highest performing group of farms had the highest milk production per cow on average. This can be seen moving from quintile one to quintile five. The top quintile of farms averaged 88.8 to 97.8 pounds per cow per day. The bottom quintile on the other end of the range averaged 72.1 to a high of 80.6 pounds per cow per day. Somatic cell count, as well as other management areas, including pregnancy rate, cull rate, DM fed per cow per day, and percent forage do not always exhibit higher ranges of performance in the top quintile.
In the area of feed conversion, the top quintile of herds in component performance also averaged the highest pounds of ECM per pound of DM. In quintile five feed conversion ranged from an average of 1.62 to 1.76. Comparatively, the bottom quintile of farms had a feed conversion ranging from an average of 1.40 to 1.61. Generally, average pounds of ECM per pound of DM increased from the bottom to top production group. A similar trend can be
On average, as components per cow per day increases, so does net milk income feed costs using fixed milk prices. Higher component herds have higher feed conversion, higher pregnancy rates, lower somatic cell counts, and lower cull rates. A combination of the percent of components and milk production lead to the high component production, with farms achieving high component production with different levels of percent components and milk production. Monitoring a variety of farm performance metrics can be an important tool in managing to meet production goals in dairy herds.
Lainey Koval is a Research Assistant, Cornell CALS PRO-DAIRY, Cornell University Class of 2024. Jason Karszes (jk57@cornell.edu) is a Senior Extension Associate, Cornell CALS PRO-DAIRY.


Be the first to comment