

The Extension Dairy Team has been working with producers and providing them with comparative financials and production metrics from other states.
Production perspective:
Pennsylvania ranks seventh and MN eighth in the country for the pounds of milk produced annually. The keystone state has 5,430 dairy operations with an average herd size of 89 cows compared to MN with 3,470 herds averaging 180 to 200 cows. Milk production and cow numbers are similar. Minnesota has higher acreage devoted to grain production compared to PA, whereas the opposite is true regarding silage production.
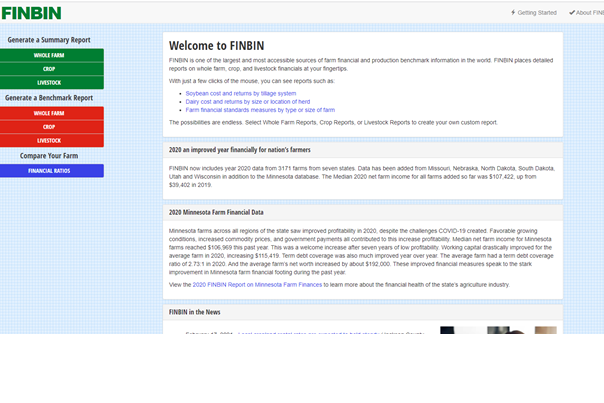 Four years of financial data for the dairy enterprise was summarized using FINBIN® for PA and MN. Even though the PA farms generated more income compared to MN, there was a large difference in the expenses resulting in a competitive cost of production for MN at $17.18/cwt compared to PA’s $19.55/cwt. It is noteworthy that both states had similar average milk prices. Feed and overhead costs explained most of the differences in expenses. Based on multiple years of analyzing PA herds, feed costs, especially home-raised feeds, are the bottleneck to sustainable cost of production.
Corn silage, grass hay, corn grain, and soybeans were the crops with the most data over four years in the FINBIN® database. Even though both states had a similar cost of production ($/ton) for silage, the yields were much higher for MN farms at 22 tons per acre compared to PA’s 19 tons per acre. Operations in PA however are producing hay much cheaper than the market price listed for 2020 compared to MN where they can purchase hay cheaper than producing it. The problem for PA herds is not having enough acreage for the number of animals on-farm. Many times, producers need to purchase grass hay to feed dry cows and heifers. Having to pay $174/ton for hay versus a cost of production of $111/ton can quickly increase feed costs and erode a competitive cost of production for the dairy enterprise.
For corn and soybeans, the cost of production is competitive for both states compared to what the market is paying. In the FINBIN® database, MN has much higher yields per acre for corn grain compared to PA, however, the keystone state has higher soybean yields. There are some noteworthy differences in the financial summary for grain production. The PA farms are dairy operations producing grains either to feed on-farm or to sell as a cash crop. The MN farms are probably a combination of livestock and crop only producers. These farms had additional expenses related to storage, handling, trucking, and marketing. This explains some of the higher expense categories on the MN operations compared to PA.
The Extension dairy business management team has been working with dairy producers for several years analyzing their financial data for the dairy, whole farm, and cropping enterprises. Adding PA to the FINBIN® database provides the opportunity to compare financials and production metrics with other states. The challenge for PA herds is lowering their cost of production to remain competitive with the rest of the nation. This is crucial if the dairy industry is to grow and thrive in the northeast. A new fact sheet titled ” Dairy Enterprise and Crop Budgets for Pennsylvania ” can be found on the Extension website.
Economic perspective:
Monitoring must include an economic component to determine if a management strategy is working or not. For the lactating cows, income over feed cost is a good way to check that feed costs are in line for the level of milk production. Starting with July 2014’s milk price, income over feed cost was calculated using average intake and production for the last six years from the Penn State dairy herd. The ration contained 63% forage consisting of corn silage, haylage, and hay. The concentrate portion included corn grain, candy meal, sugar, canola meal, roasted soybeans, Optigen, and a mineral vitamin mix. All market prices were used.
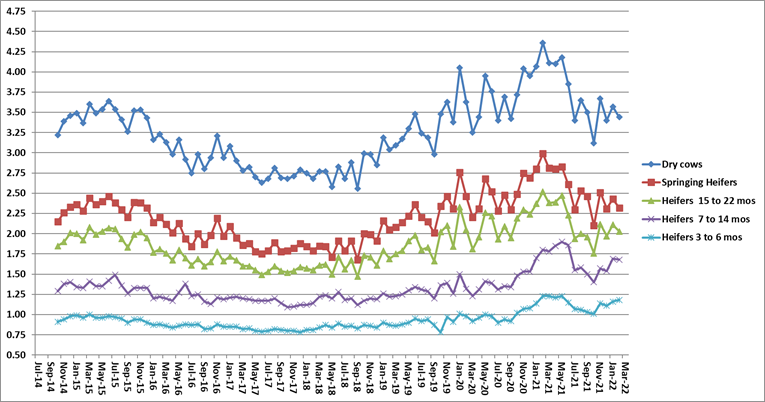
Also included are the feed costs for dry cows, springing heifers, pregnant heifers, and growing heifers. The rations reflect what has been fed to these animal groups at the Penn State dairy herd. All market prices were used.
Income over feed cost using standardized rations and production data from the Penn State dairy herd.
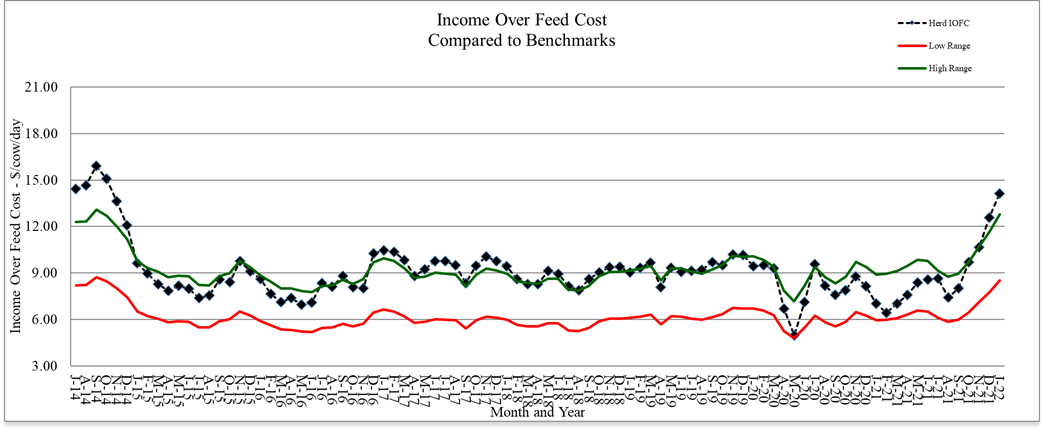
Note: January’s Penn State milk price: $25.07/cwt; feed cost/cow: $7.20; average milk production: 85 lbs.
Feed cost/non-lactating animal/day.


Be the first to comment