The last post covered the growth in milk production. The growth in milk production over five years is 2.4% (see this post). The cow count for the U.S. has grown by just .5% over the same 5 years. This post will cover in detail the monthly growth in milk per cow. Most states have increased milk per cow, and a few have lower milk per cow. All data in this post is based on 12-month moving averages to avoid annual cycles.
Chart I below shows the growth in milk per cow for the U.S. The growth in milk per cow was strong beginning of 2021 but since has slowed. In 2025 there is almost no growth.
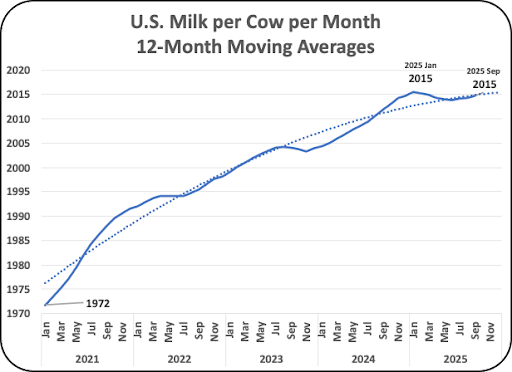
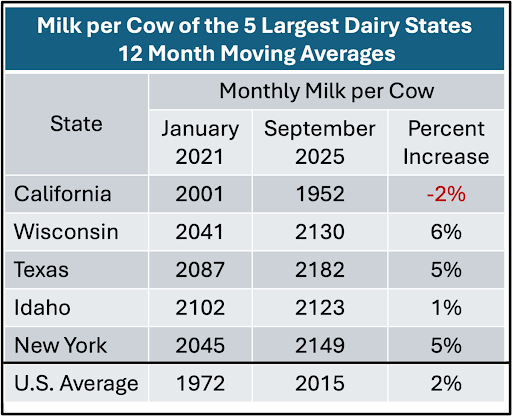
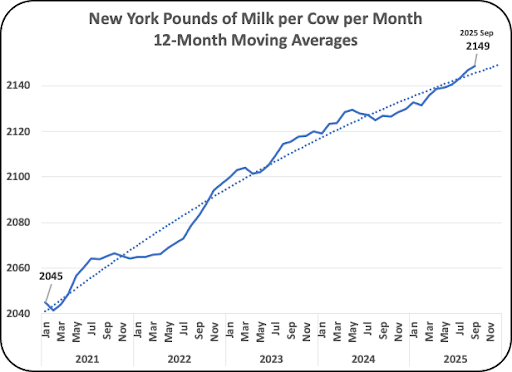
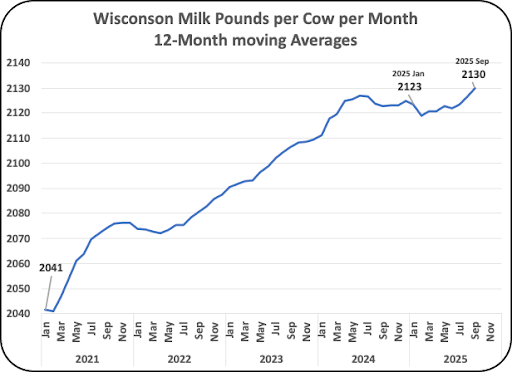
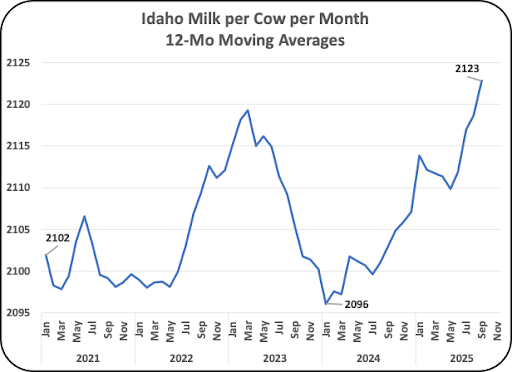
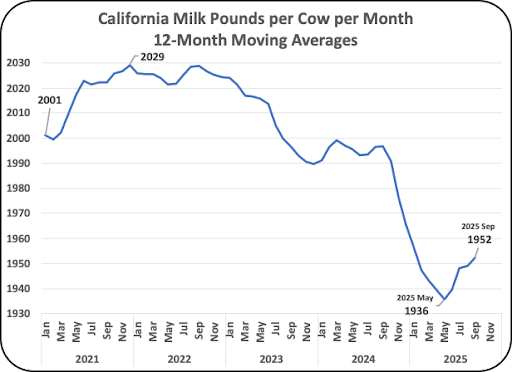
Table I below compares the five largest dairy states progress on increasing milk per cow. They are the biggest contributors to the U.S. average and make up 55% of the U.S. milk. Following Table I are charts of the progress made in each state.

Five Largest Dairy Producing States
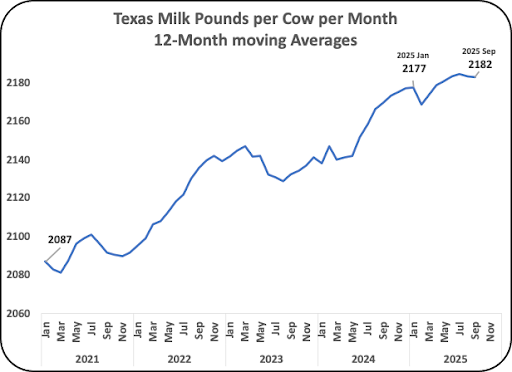


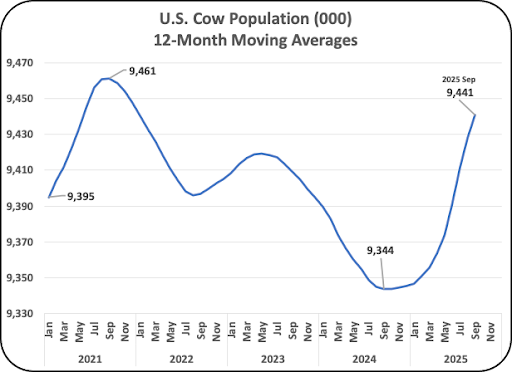
The U.S. cow population increased by 1% in 2025. It is not at record highs, although the volume of milk production is at record highs. That validates the impact of increased milk per cow. While the increase in cow count has contributed to the increase in milk production, as mentioned in the opening statement in this post, most of the increase in milk production has resulted from improved technology and management.

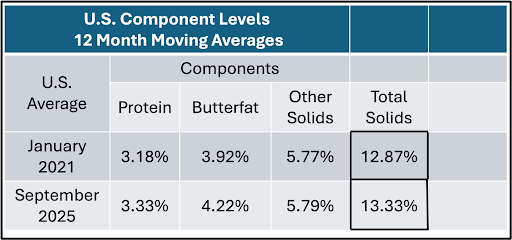
More milk per cow is an important element in providing low-cost dairy products. Combining the increasing milk per cow with the increasing level of components in that milk expresses the impact of these two elements combined. Table I below shows the increase of higher components. Protein levels have increased by 5% and butterfat levels have increased by 8%. Other solids have increased only slightly.

Additional changes will be followed in future posts to this blog.
Other recent posts are available at this link, and older posts are available at this link.

Be the first to comment