
The backbone of the American economy is our infrastructure system – the roads we drive on, the bridges we cross,and the waterways we use for shipping. With a new infrastructure spending bill on the mind of many on Capitol Hill, this Market Intel will shed some light on current and historical spending patterns on America’s roadways and waterways.
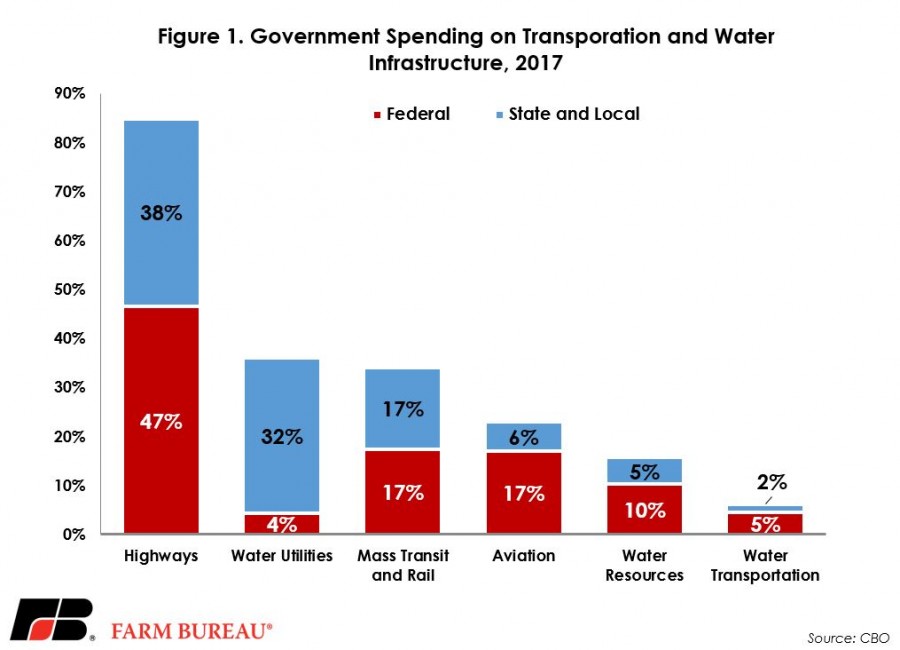
Infrastructure projects typically are expansive and costly public systems and facilities created and maintained through federal, state and local government funds. According to the Congressional Budget Office, in 2017 public spending on transportation and water infrastructure accounted for $441 billion through either direct spending or grants. At $177 billion in 2017, U.S. highways are the largest infrastructure expenditure, accounting for 40% of total transportation- and water-related public spending. The largest spending discrepancy between federal and state and local is in water utilities, including water supply and wastewater treatment facilities. Water utilities account for $4 billion, or 4%, of the federal infrastructure budget and $109 billion, or 32% of the state and local budget. Figure 1 outlines the percentage of government expenditures in 2017 for some of the largest infrastructure investments.
Ground Transportation
The U.S. highway system is funded through the Fixing America’s Surface Transportation (FAST) Act and the Highway Trust Fund . The FAST Act authorizes $305 billion over fiscal years 2016 through 2020 with a focus on highway safety and structural highway programs. The HTF historically funded all federal highway programs, as well as 80% of the public transportation programs, with fuel, truck and tire taxes.
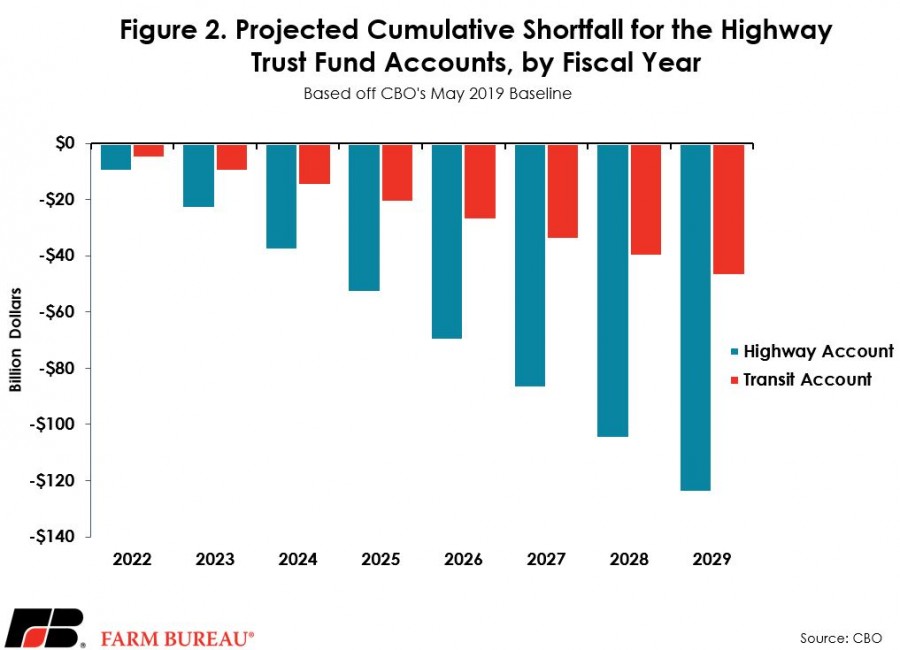
While increases in fuel consumption since 1993 had been maintaining the HTF, after the recession starting in 2007, a greater propensity for fuel efficiency has stymied the revenue growth of the HTF, leading to consistent overspending. Based on CBO’s latest baseline and trends, the HTF will begin realizing cumulative shortfalls in 2022, resulting in up to a $124-billion deficit in the highway account by 2029, Figure 2.
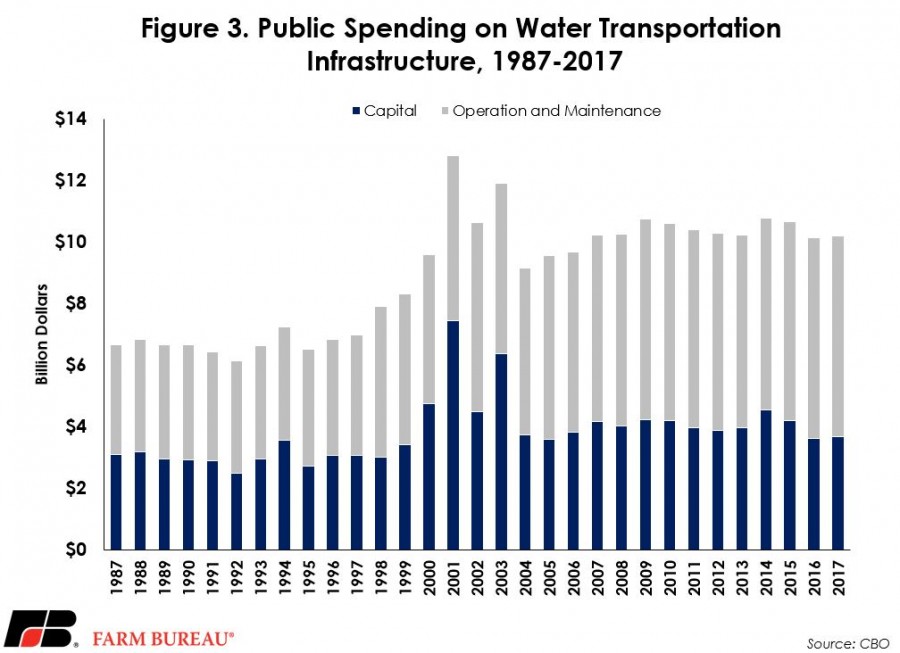
Waterways
State Local Expenditures
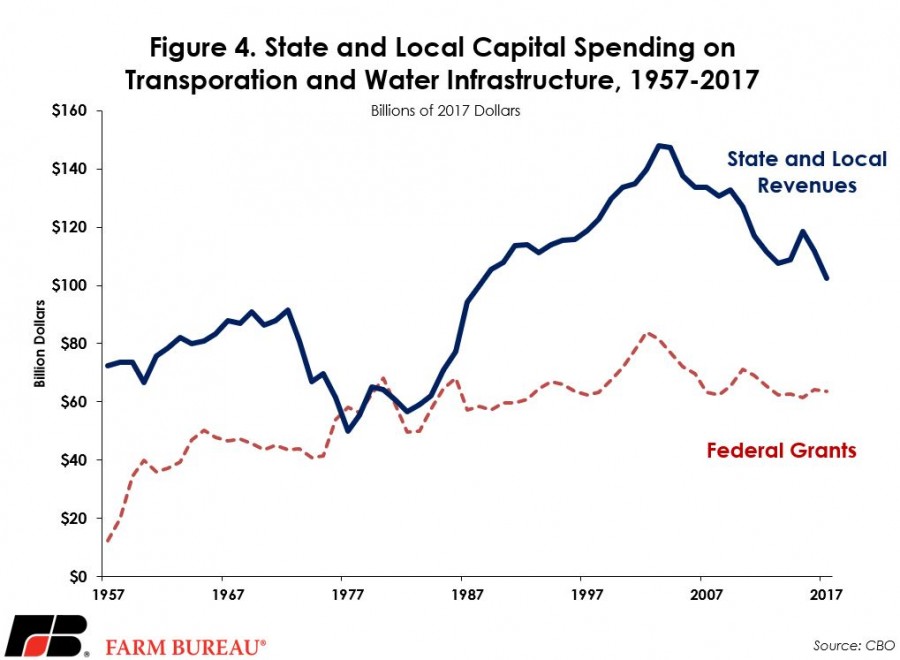
For the past 60 years, state and local capital spending on transportation and water has seen an average annual growth rate of about 1%, with over half of the spending coming from state and local revenues. In 2017, state and local revenues were $102 billion and federal grants $64 billion, or 62% of total capital spent. State and local revenues have consistently outpaced spending from federal grants since 1981. Figure 3 illustrates the trend of state and local capital spending on transportation and water infrastructure from 1957 to 2017.
With no agreed upon definition of what is included in “infrastructure,” determining the level of funding needed and where it should be authorized continues to be a problem. Some define infrastructure more narrowly, identifying key systems such as transportation, water and energy, while other definitions include telecommunications, education, recreation and health. To meet the diverse demands of urban, suburban and rural communities and maintain a strong economic standing, vital infrastructure improvements must be made. Particularly for rural communities and American agriculture, the stability of the nation’s highways, bridges, railways, locks and dams, harbors and ports is paramount. Strong federal investment along with creative solutions are necessary to meet the challenges of rural America.


Be the first to comment