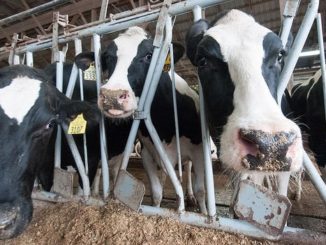
When the dairy industry is in financial turmoil, it is not the processor or retailer who suffers, it is the producer. The typical producer approach is to cut all expenses and hold on tight. Although no surveys have been done on this, the general consensus is that most producers use the “cut all expenses” approach in tough times.
While this post is intended for all U.S. producers, the message is especially important for California producers who will be new to the FMMO formulas for minimum pay.
Table I below shows the impact if the nutritional changes get an additional .1% in butterfat. Table II shows the impact if nutritional changes get an additional .1% in milk protein. Table III shows the impact of nutritional changes when both butterfat and milk protein increase by .1%. The cost, if any, of making the nutritional changes is not shown because every herd is fed differently and the cost of the change will be different. Typically, the cost varies between nothing and $.10 per day. A nutritionist who has up-to-date software that accurately calculates the cost of nutritional changes can best calculate the change in feed cost. The last table, Table IV, is based on a compilation of results from carefully monitored herds that have implemented nutritional changes to maximize components.
In Table I below, a small change in butterfat is evaluated. In this analysis, if butterfat was increased from 3.5% to 3.6%, the increase in revenue at current values is worth $.25 per cwt. of milk and at 65 lbs. of milk per day, the increased revenue per cow is $.16 per day.
 |
| Table I – Revenue Impact from Increasing Butterfat by .1% |
Table II illustrates the financial impact when milk protein is increased from 3% to 3.1%. At current prices, that would increase revenue by $.15 per cwt. or $.10 per cow per day. While the value of milk protein is currently low by historical values, it is still a strong contributor to increased revenue.
 |
| Table II – Revenue Impact from Increasing Protein by .1% |
Table III shows the impact of increasing both butterfat and milk protein by .1% each. Even though the changes in components are very small, the increase in revenue is substantial. Revenue per cwt. increases by $.40 and revenue per cow increases by $.26 per day. When nutritional changes are made, typically both milk protein and butterfat increase
.
 |
| Table III – Revenue Impact from Increasing Protein and Butterfat by .1% |
Table IV shows a more realistic impact from amino acid balancing. In this case butterfat is increased by .18% and milk protein is increased by .14% and milk volume is increased by 2 lb. per cow per day. The resulting improvement in revenue is $.66 per cwt. or $.73 per cow per day.
 |
| Table IV – Revenue Impact from Diets Balanced for Amino Acids |
All of the results displayed above increase revenue more than the cost of feeding a diet balanced for amino acids. There have been articles by other well-respected nutritionists on this subject with the same advice. Precise changes can produce better results than a shotgun blast of “reduce all expenses.”
Editor’s Note: John Geuss is a dairy consultant based in Florida. This information appears in his Milk Price blog column sponsored by Addiseo and is published here with permission. He may be contacted at johngeuss@gmail.com