

In the January 22 post to this blog, the decrease in fluid milk was covered. As less fluid milk is produced, there is less butterfat removed and available for various products containing butterfat. The mix of the fluid milk decline is also important as lower fat milk is declining faster than whole or two percent fat milk.
When fluid milk is produced, the first step is to remove all butterfat with a cream separator. The proper amount of butterfat is then added to the milk to meet the label requirement. Whole milk must contain 3.25 percent butterfat followed by two percent and one percent fluid milk. Fat free milk gets no butterfat added. Currently, butterfat in producer milk is nearly four percent butterfat. The dynamics of the available butterfat left from fluid milk production include the following:
- The amount of butterfat in milk is increasing. (See the Oct 24, 2021 post to review component levels over time.) Therefore, more butterfat should be available.
- Fluid milk sales are declining, making less butterfat available.
- The mix of fluid milk is changing. The products that allowed the most butterfat to be harvested are one percent fat and fat free milk. These two categories of milk are declining the fastest.
In this analysis, whole milk includes both regular milk and flavored whole milk. Two percent milk also includes “flavored fat reduced” milk. Data for one percent fat and fat free milk are taken as reported. This analysis includes both conventional milk and organic milk. The years 2017 and 2021 are compared below. During this time, butterfat in milk grew from 3.8 percent to 3.95 percent and that is also taken into consideration in this analysis.
Chart I below compares sales of fluid milk from 2017 and 2021. Whole milk has maintained steady sales. There has been an 11 percent drop in two percent fat milk, a 20 percent loss in one percent fat milk and a 40 percent drop in fat free milk sales.
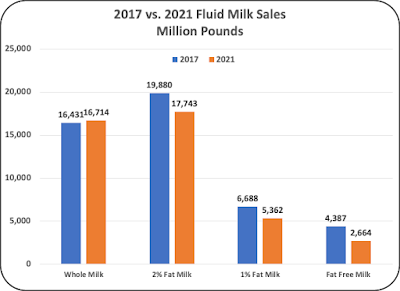 |
| Chart I – Milk by category for 2017 and 2021 |
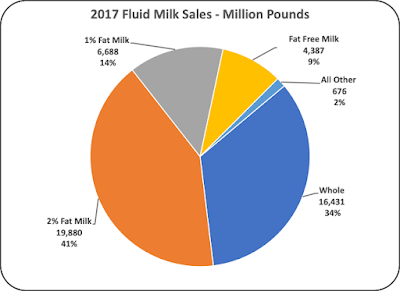 |
| Chart II – Mix of Milk Products in 2017 |
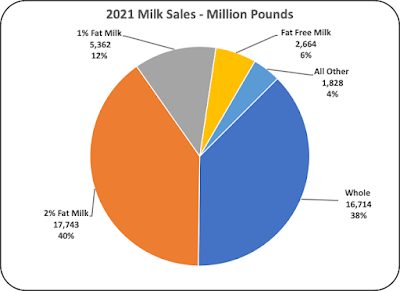 |
| Chart III – Mix of Milk Products in 2021 |
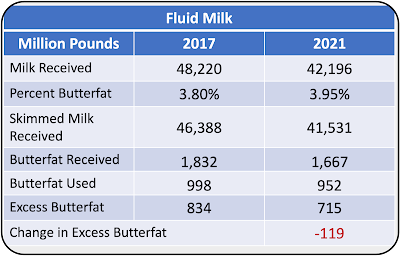 |
| Table I – Impact on Butterfat Availability from Fluid Milk |
Is 155 million pounds of butter from the excess butterfat in fluid milk a significant amount? Chart IV shows the annual butter production from 2017 to 2021. From the high of 2145 million pounds of butter produced in year 2020 to the 2069 million pounds of butter produced in year 2021, there is a 76 million pound drop. From the low of 1847 million pounds in 2017 to the current level of 2069 million pound in year 2021 there was an increase of 222 million pounds of butter.
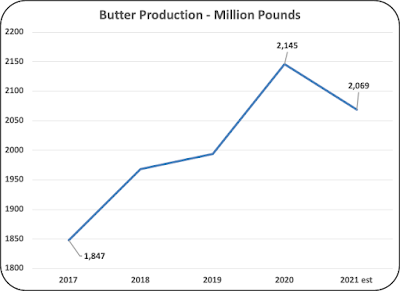 |
| Chart IV – Annual Butter Production |



Be the first to comment