

Nothing remains the same and certainly the U.S. dairy industry is always changing, geographically changing. The production of milk, the processing of milk, and other facilities in the chain are tightly related. This post will provide an analysis of the most recent geographic changes. The data used in this post is based on 12-month moving averages.
The first table below identifies the largest dairy states. These five states produce more than 50% of the U.S. milk.
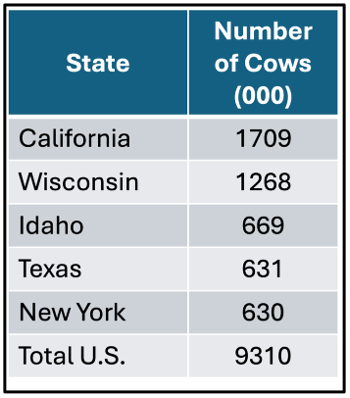
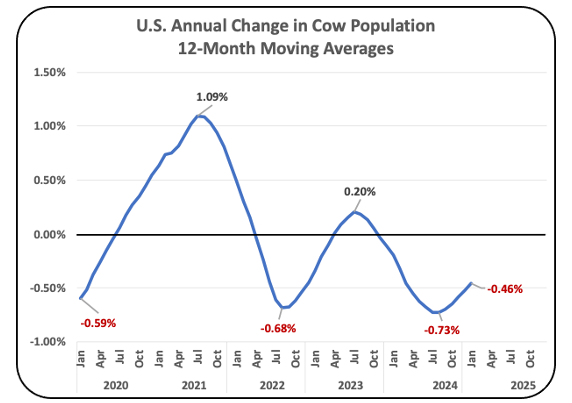
Chart I below follows the annual percentage change in the U.S. cow population. The decreases and trends suggest that even faster decreases will occur. Cows with more milk per cow and higher component levels reduce the number of cows needed.
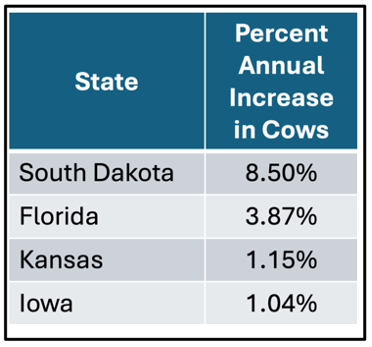
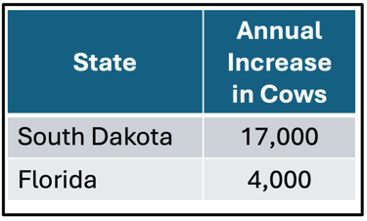
WHERE ARE COW NUMBERS INCREASEING?
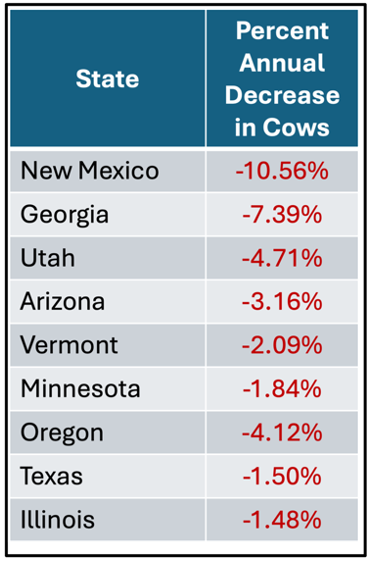
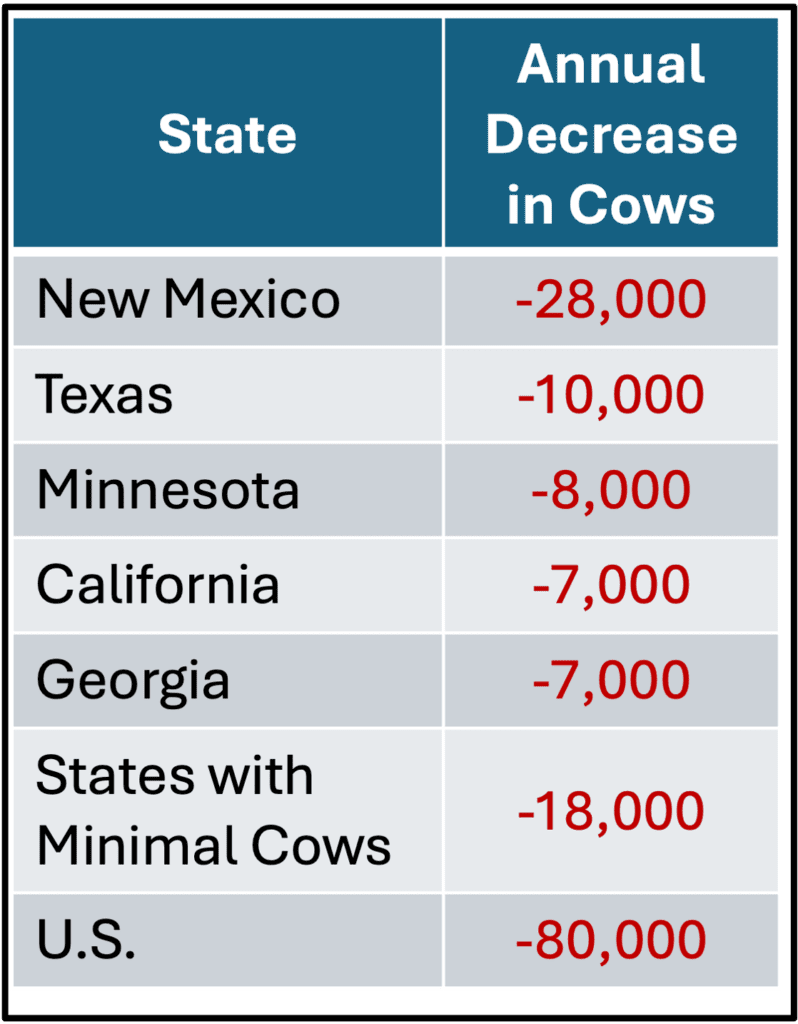
WHERE ARE COW NUMBERS DECREASING?
The list here is much larger (Tables IV and V). New Mexico continues to decrease milk production as heat waves, water availability, overall cost of operations, and ground contamination continue to make New Mexico an unfavorable environment for milk production. Georgia is also losing a lot of cows, while Florida is growing. Smaller dairy states not included in the list of the 24 larger dairy states have seen significant decreases and represent nearly 25% of the total U.S. decreases in cow numbers.
WHAT MOVES WITH THE COWS?
To have a complete and successful dairy operation, producers, feed mills, processors, milk handlers, and a lot of facilities need to work together. That can create a major boom in new areas and those supporting this development will need to integrate the development effort to “follow the money.”
Obviously, South Dakota is an area that requires the skill of all aspects of dairy product production and it is welcoming dairy expansion to the state.
Companies supporting dairy operations should concentrate on these two growing areas.
Be the first to comment