
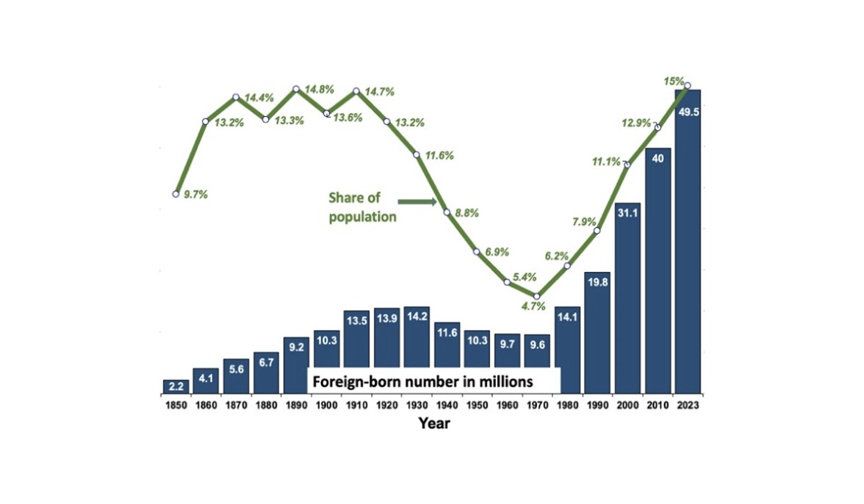
Latin Americans now make up 53.5% of the total foreign born immigrant population living in the US.Looking at where the majority of the recent immigrants are coming from (Jan 2021 – Oct 2023), the largest numbers of immigrants are coming from South America (28%), Central America (25%) and the Caribbean (20%), while despite numerically still being the largest group, the growth in number of immigrants from Mexico has almost halted. In October 2023, Latin Americans made up 53.5% of the total foreign-born population living in the US. The increased numbers of Central Americans reportedhere coincides with trends we have observed in our dairy training numbers and points to an increasing population of primarily younger male individuals with limited educational background, a tendency to speak primarily indigenous languages, and typically of a shorter body stature compared to Anglo or Hispanic workers.
Number of unauthorized or illegal immigrants changing these survey numbers.There is much discussion and debate across the spectrum of sources about how the numbers of illegal or unauthorized immigrants impact survey numbers. The Migration Policy Institute reports detailed 2019 SIPP based data (Survey of Income and Program Participation, US Census Bureau), indicating 11M unauthorized immigrants in the US: 54% male and 46% female, 74% under the age of 45, 46% has a below 12th grade education level, 24% with a HS or equivalent level education, and 30% has obtained some college, associate degree, BS, or advanced degree. The data indicate that 46% speak English “not well” or “not at all”, and 72% indicates Spanish as their language spoken at home. Interestingly, 30% of this group of immigrants reports not to be active in the labor force, 4% reports to be unemployed, which says that the Labor Force Participation rate in this group is comparable to that the overall US (62.7%) rate. More on that later. The PEW Research Center reports 10.5M unauthorized immigrants in 2021(22% of the total foreign-born population), a number fairly stable since 2005. In general, it seems widely accepted that roughly three quarters of the foreign-born immigrants are in the US legally while about one quarter is not.
However, the Center for Immigration Studies on November 30 of this year reasons that the number of illegal immigrants, including newly released November 9, 2023 Census Data are already obsolete, and that the number could be as high as 15M as of October 2023 using Current Population Survey (CPS) data, pointing to a sharp increase of more than half (2.5 million) of the 4.5 million increase in the foreign-born population since January 2021 is likely due to illegal immigration. What is the current labor pool in agriculture anyway?Getting a good estimate for the current labor pool in agriculture is challenging at best, primarily because the Ag numbers have to be pieced together from several incomplete and inconsistent datasets providing data from different segments of the farm workforce (Economic Policy Institute). The most recent (monthly) employment survey data available through BLS focus on nonfarm payroll employment, eventhough one of their surveys, the household survey, has a more expansive scope and includes agricultural workers. The October 2023 BLS report indicates that there are 2.2M seasonally adjusted workers in agriculture and related industries vs. almost 160M in nonagricultural industries. The 2017 NASS census data reported 2.4M farmworkers, this number will likely be updated with the release of the 2022 NASS Census data by USDA on Feb 13, 2024. The 2.2M equates to 1.4% agricultural workers in the US workforce. The Economic Policy Institute in an October 3, 2023 article does a nice job explaining the complexity of determining the number of farmworkers in the US and reaches the conclusion that there are roughly 2.4M farmworkers, and that there are 1.5 farmworkers for every FTE in agriculture nationwide.
Getting to the point: with that many immigrants, why dairy continues to struggle to find labor?Given all the reasons the September 2023 BLS Employment Projection report lists: a lower non institutional population growth (0.7% vs. 0.8% annually during 2012-2022), a fast growth of age group 65+ with all baby boomers aging into that group by 2032, a slower annual civilian labor force growth (0.4% vs. 0.6% annually during 2012-2022), a decreasing labor force participation rate due to greater share of individuals over the age of 65 (projected to fall from 62.2 percent in 2022 to 60.4 percent in 2032); the total employment is projected to grow 0.3 percent annually from 164.5 million in 2022 to 169.1 million in 2032. This 0.3% projected growth is much slower than the 1.2% annual employment growth in the 2012-22 decade, which was marked by strong recovery growth following the 2007-09 Great Recession and 2020 COVID-19 recession. The BLS in their Occupational Outlook Handbook for Farming, Fishing and Forestry does mention that there will be an increased need (3% growth rate) for first line supervisors, which is easily explainable given the growth rate of farm sizes in animal agriculture in general.
Ultimately, an interesting and telling graph from a Center for Immigration Studies report (November 9, 2023) utilizing BLS US Population Projections indicates the impact immigration has on the working age share of the US population under three different immigration scenarios, and which in all three scenarios predicts the number of working age share of the US population will continue to decline to between 57.6% and 58.5% by 2060, down from 60.9% in 2022.
In other words, don’t count on immigration – our main supply line for dairy workers – to fill the labor void on your dairy as decreasing labor participation will not only eat the icing, but also part of the cake!



Be the first to comment