

138 Dairy Farms, New York State, 2021
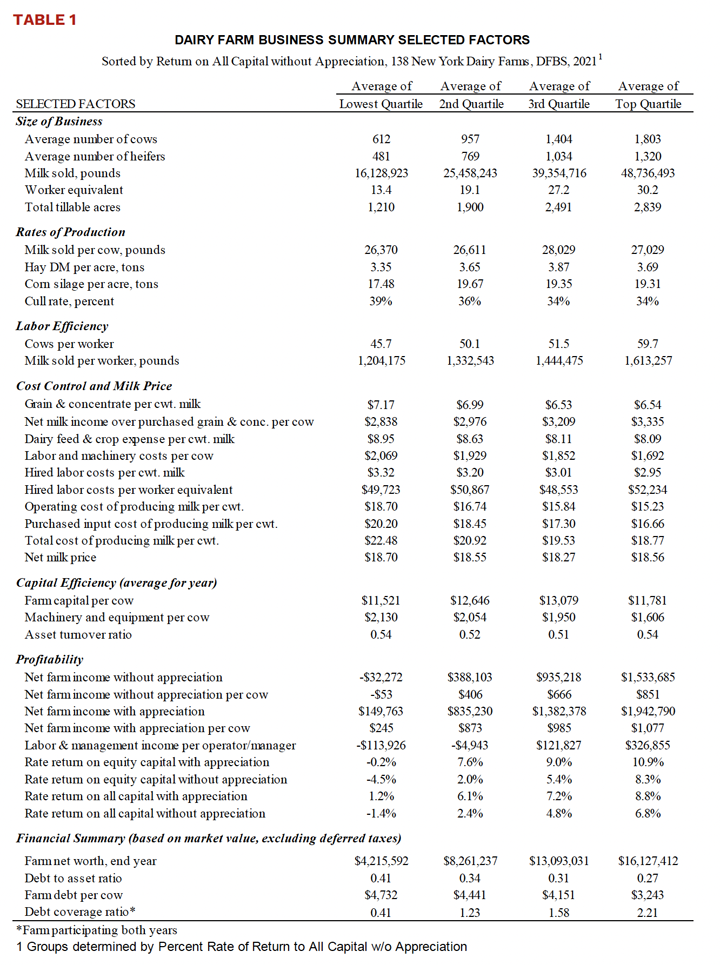
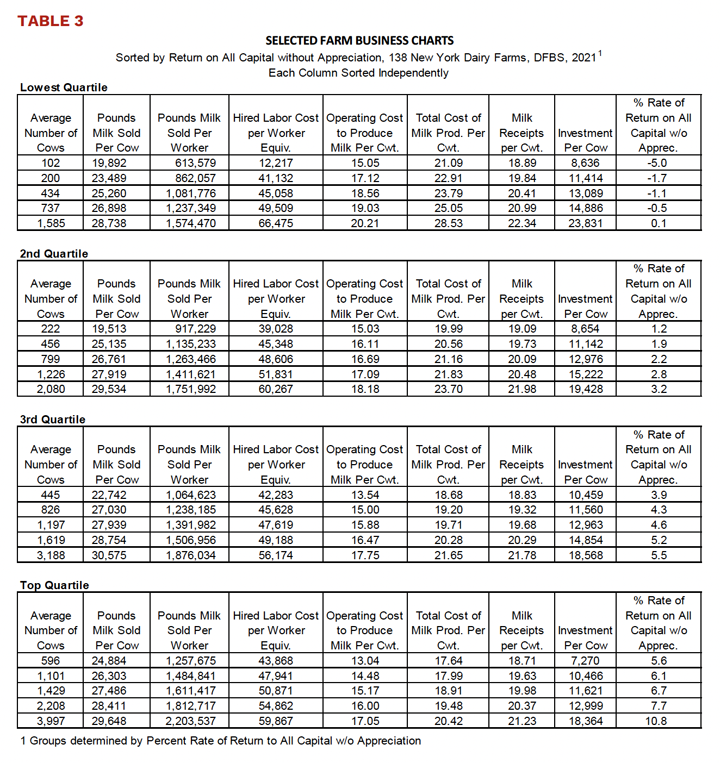
Table 1 highlights selected measures of size, efficiency, costs, and profitability for the four groups. Continuing an ongoing trend, as earnings increased, so did herd size, with the lowest quartile of farms averaging the smallest herd size, and the highest quartile of farms by earnings averaging the largest herd size. While there is a trend towards larger farms averaging higher earnings, a range of herd sizes is represented in each quartile of farms. In Table 3, the quartile range of herd sizes for the lowest earning group of farms was 102 to 1,585 cows and the quartile range in herd size for the highest earning farms was 596 to 3,997. The quartile range of farms is the average of farms by 20 percent increments for that measure.
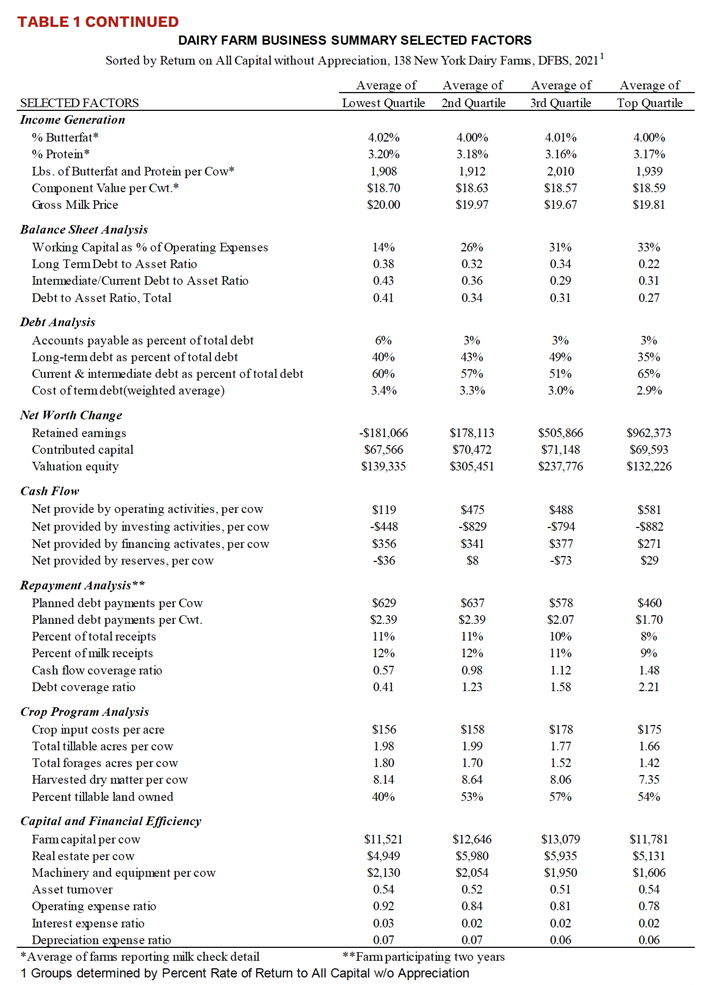
Increase in herd sizes are correlated with increased worker equivalent, or one person working 2,760 hours a year, and total tillable acres. However, with increased herd sizes, efficiency is increased, with milk sold per worker equivalent going from an average of 1,204,175 pounds for the lowest quartile of farms to 1,613,257 pounds for the highest quartile of farms. With this increase in efficiency, the highest quartile of farms achieved the lowest cost per cwt for hired labor, averaging six cents per cwt less than the next closest quartile, while averaging the highest cost per worker equivalent. While the higher earning quartiles worked more acres in total, the acres worked per cow fell from 1.98 acres per cow for the lowest quartile of farms to 1.66 for the highest quartile of farms. The utilization of less acres per cow helped lead to the second lowest total capital investment per cow and the lowest investment per cow in machinery and equipment for the highest quartile of farms.
The highest quartile of farms averaged the second highest milk sold per cow, with the second highest quartile of farms averaging the highest production per cow at 28,029 pounds. All four quartiles averaged within 1,670 pounds of each other. While the average milk sold per cow is higher for the two highest quartile of farms, as is reported in Table 3, there is a large range in milk sold per cow. Farms in the highest earnings quartile range from 24,884 pounds sold per cow to 29,648 sold per cow. Along with averaging the highest milk production, the two highest quartile of farms by earnings had the lowest cull rate, averaging 34 percent for the year.
The average net milk price received across the four quartiles ranged from a low of $18.55 per cwt for the third quartile of farms to a high of $18.70 for the lowest quartile of farms. There is no relationship between milk prices and average earnings across the quartiles, with the highest quartile of farms averaging 14 cents lower milk price than the lowest quartile of farms.
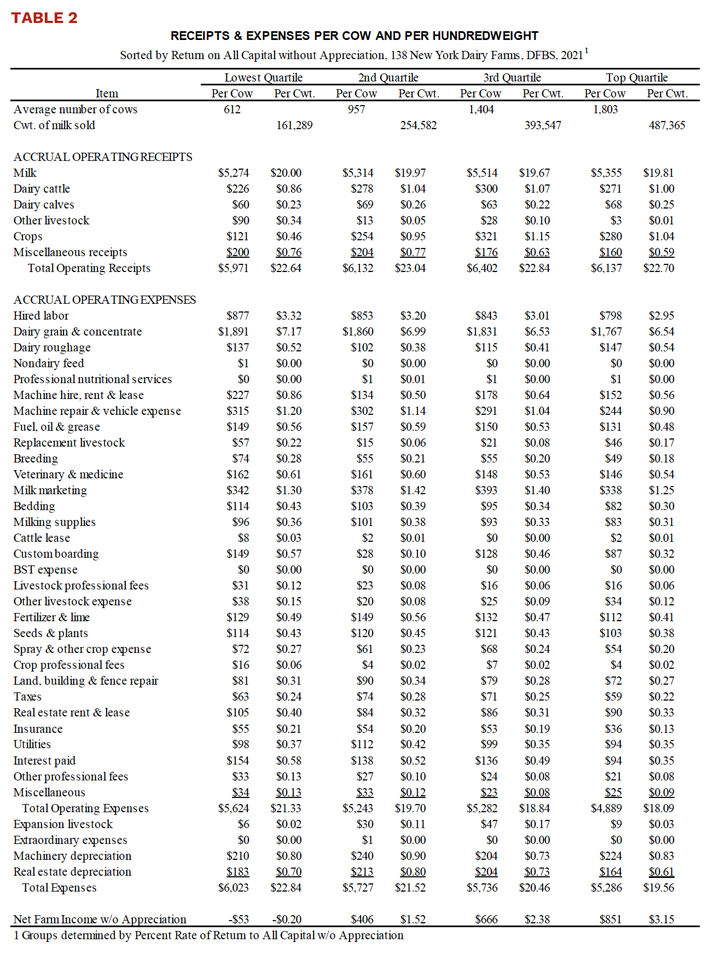
Total costs to operate the farm decreased, moving from the lowest quartile of farms to the highest quartile of farms, with the average falling from $21.33 per cwt to $18.09 per cwt, a difference of $3.24 per cwt (Table 2). With the smaller variation in milk production per cow across the quartiles, the lower cost per cwt is driven by lower total expenses per cow, with the highest quartile of farms averaging the lowest operating cost to run the farm on a per cow basis. With expenses divided into 31 separate expense categories, differences can be highlighted across the four groups. The highest quartile of farms had the lowest average cost per cow in 21 of the 31 expense categories. Machinery repair, fuel, fertilizer, seed, spray and chemicals, and rent expenses all averaged the lowest of the four groups and can potentially be a result of less acres per cow and higher asset utilization. However, with purchased forage expense for the highest quartile averaging the highest per cow across the quartiles, this also may be a result of less acres per cow.
The highest quartile of farms averaged the second highest milk sales per cow, following the third quartile. They also average second highest in revenue per cow for dairy cattle, dairy calves, and crops. They were the second highest in crops, even though they average the lowest acres per cow. The combined impact of all the revenue sources resulted in the highest quartile of farms averaging the second highest in revenue per cow, $265 dollars less revenue per cow than the third quartile.
For the lowest quartile of farms, the operating costs to produce milk averaged $18.70 per cwt, with the highest quartile of farms averaging $15.23 per cwt. Incorporating depreciation expenses and values for family contributions of labor, management, and equity resulted in a total cost of producing milk of $22.48 per cwt for the lowest quartile of farms, and $18.77 per cwt for the highest quartile of farms as determined by the rate of return on all capital without appreciation.
Analyzing how your business compares to industry benchmarks can be useful to identify areas to consider making management changes. If you are interested in participating in the Dairy Farm Business Summary and Analysis Program, please reach out to the Cornell Cooperative Extension farm business management extension educator in your county.
1 Progress of the Dairy Farm Report, E.B 2022-10, Karszes, J & Augello, L, Cornell Dairy Farm Business Summary and Analysis Program, Charles H. Dyson School of Applied Economics and Management, College of Agriculture and Life Sciences, Cornell University, Ithaca, NY, June 2022


Be the first to comment