

BUTTERFAT
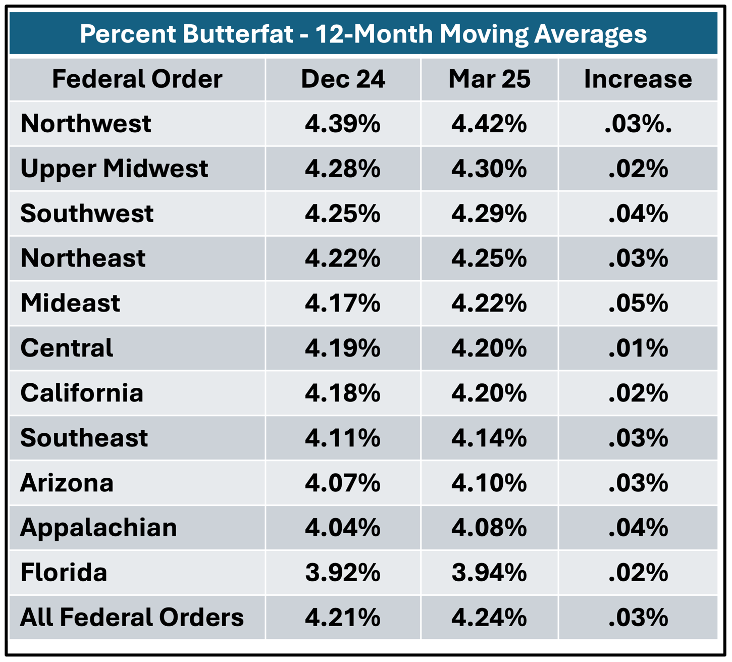
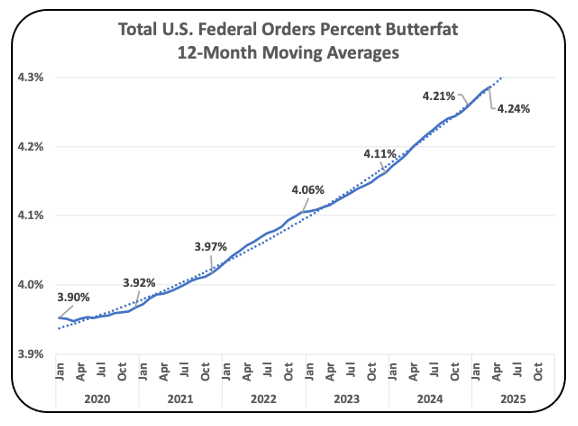
Chart I below follows the increase in butterfat levels over five years. The increases have been very steady with almost no decreases. The trend line shows an increasing monthly rate of higher butterfat levels.
MILK PROTEIN
Milk protein levels also show steady growth. The growth is slower than butterfat as milk protein is only paid for Class III milk and protein prices have been lower than butterfat. The Federal Order rankings below, show that there is opportunity for growth in protein levels in many Federal Orders.
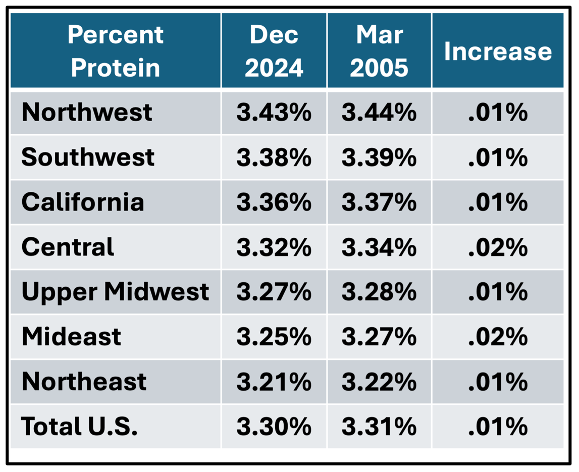
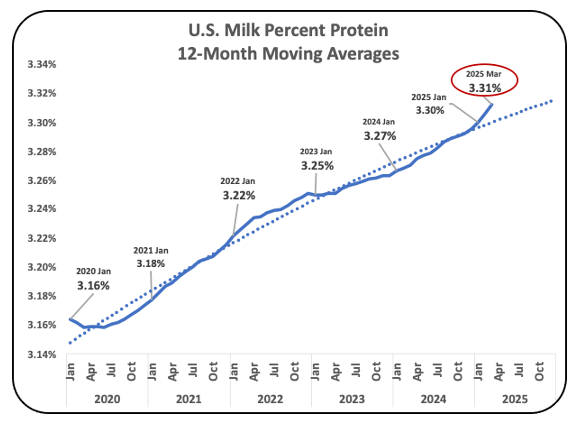
Chart II shows the long-term growth of milk protein levels. In 2020 there was a decrease impacted by COVID mandates, but since then, the increases have been steady. In the first quarter of 2025, the rate of increase made major gains.
NONFAT SOLIDS
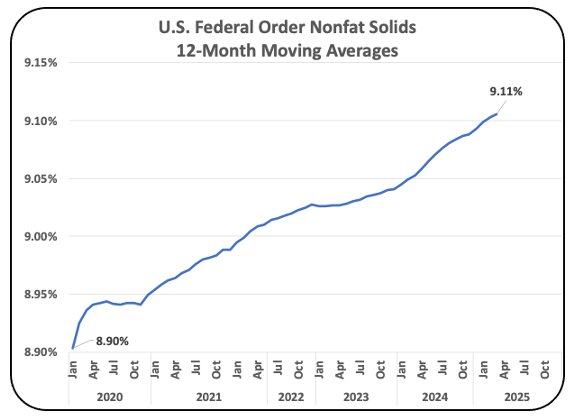
Chart III below shows the growth in Nonfat Solids, paid for Class IV milk. They are primarily growing based on increases in milk protein volumes. California, being the largest producer of butter, benefits the most from increased levels of Nonfat Solids.
IMPACT
Increasing components is key to successful dairy operations. There is one other key element to a successful dairy business, milk per cow. First quarter 2025 changes in milk per cow will be covered in the next post to this series. There is no slowing of the rate of increases in butterfat or milk protein. Continued increases can be expected.


Be the first to comment