

As covered in many past posts, the cheese price is the most important element in calculation of the Class III milk price. The Class III category is the largest of the four milk Classes. An overview of domestic dairy consumption was reviewed in the September 8 post to this blog and showed an annual growth rate of between two and three percent for domestic cheese consumption. In the prior post, “Exports Show Limited Growth,” cheese exports were shown to be stagnant. This post will cover some of the details in the changing dynamics of U.S. per capita cheese consumption and the impact these dynamics have on dairy pricing. The important commodity in pricing dairy milk
DOMESTIC CHEESE CONSUMPTION
Cheese domestic consumption is the bright spot in consumption of dairy products. The growth rate has slowed somewhat with the maturing of the U.S. cheese market, but it is still growing at a healthy rate.
Chart I shows the growth of per capita consumption of cheese by type of cheese. All types of natural cheeses have increased per capita consumption with the exception of processed cheese products. Since 2000, per capita consumption of natural cheeses has increased from 30 pounds per year to 38 pounds per year. Processed cheese products have decreased from 8 pounds per year to 7 pounds per year. Cheddar and Mozzarella make up 64 percent of the total 2018 natural cheese category. Mozzarella has the biggest share at 33 percent.
 |
| Chart I – Per Capita Consumption of Cheese |
Over the last 19 years, the mix of different cheeses has remained relatively stable. Cheddar and Mozzarella have dominated the cheese category. In 2000, Cheddar and Mozzarella represented 67 percent of total natural cheese consumption (Chart II). By 2018, those two cheeses represented 64 percent of the hard cheese market (Chart III). Cheddar cheese has lost over four percent of the market share of natural cheeses. What cheeses took that market share from Cheddar? Mozzarella has gained one percent in market share and 20 “other” cheeses that have small shares individually, but collectively have seen significant gains in market share to capture the other three percent.
 |
| Chart II – Makeup of the Cheese Category in 2000 |
 |
| Chart III – Makeup of the Cheese Category in 2018 |
Mozzarella and Cheddar remain the biggest players. Mozzarella consumption has increased by 34 percent since 2000 and is now the largest individual cheese consumed. Mozzarella has grown with the growth in Italian foods. Cheddar has increased volume by 14 percent since 2000 but now commands only 31 percent share of the current market.
Processed cheese products have decreased by 12 percent during the last 19 years as consumers tend to eat more natural cheese than processed cheeses. Much of the processed cheese uses Cheddar as the base ingredient and have thereby also decreased Cheddar consumption.
 |
| Table I – Growth of per Capita Cheese Consumption |
The important fact from the above paragraphs is that Cheddar cheese is an increasingly smaller piece of the pie. However, it is still used as the basis of the CME auction pricing and the NASS survey to establish the overall price of cheese. Because Cheddar cheese is an increasingly smaller part of total cheese production, using the Cheddar only methodology for pricing cheese can increase unintended volatility.
WHOLESALE AND RETAIL CHEESE PRICES
Chart IV shows the wholesale and retail prices of Cheddar cheese since 2000. The dotted lines are trend lines. They are all based on year end prices for each year. The retail price has increased 43 percent over 19 years while the NASS wholesale price has increased by only 27 percent. The spread between the retail price and the wholesale price has increased from $3/lb. to $4/lb. The consumer marketing of cheese has helped grow the retail price. In the last decade, the linkage between the retail and wholesale prices has lost any correlation. As an example, in 2018, the retail price of cheese went up while the wholesale price of cheese went down.
Why is this important? Keep reading. Please note that in 2016 and 2017 the retail Cheddar prices were below the trend line.
 |
| Chart IV – Retail and Wholesale price of cheese – $/lb. |
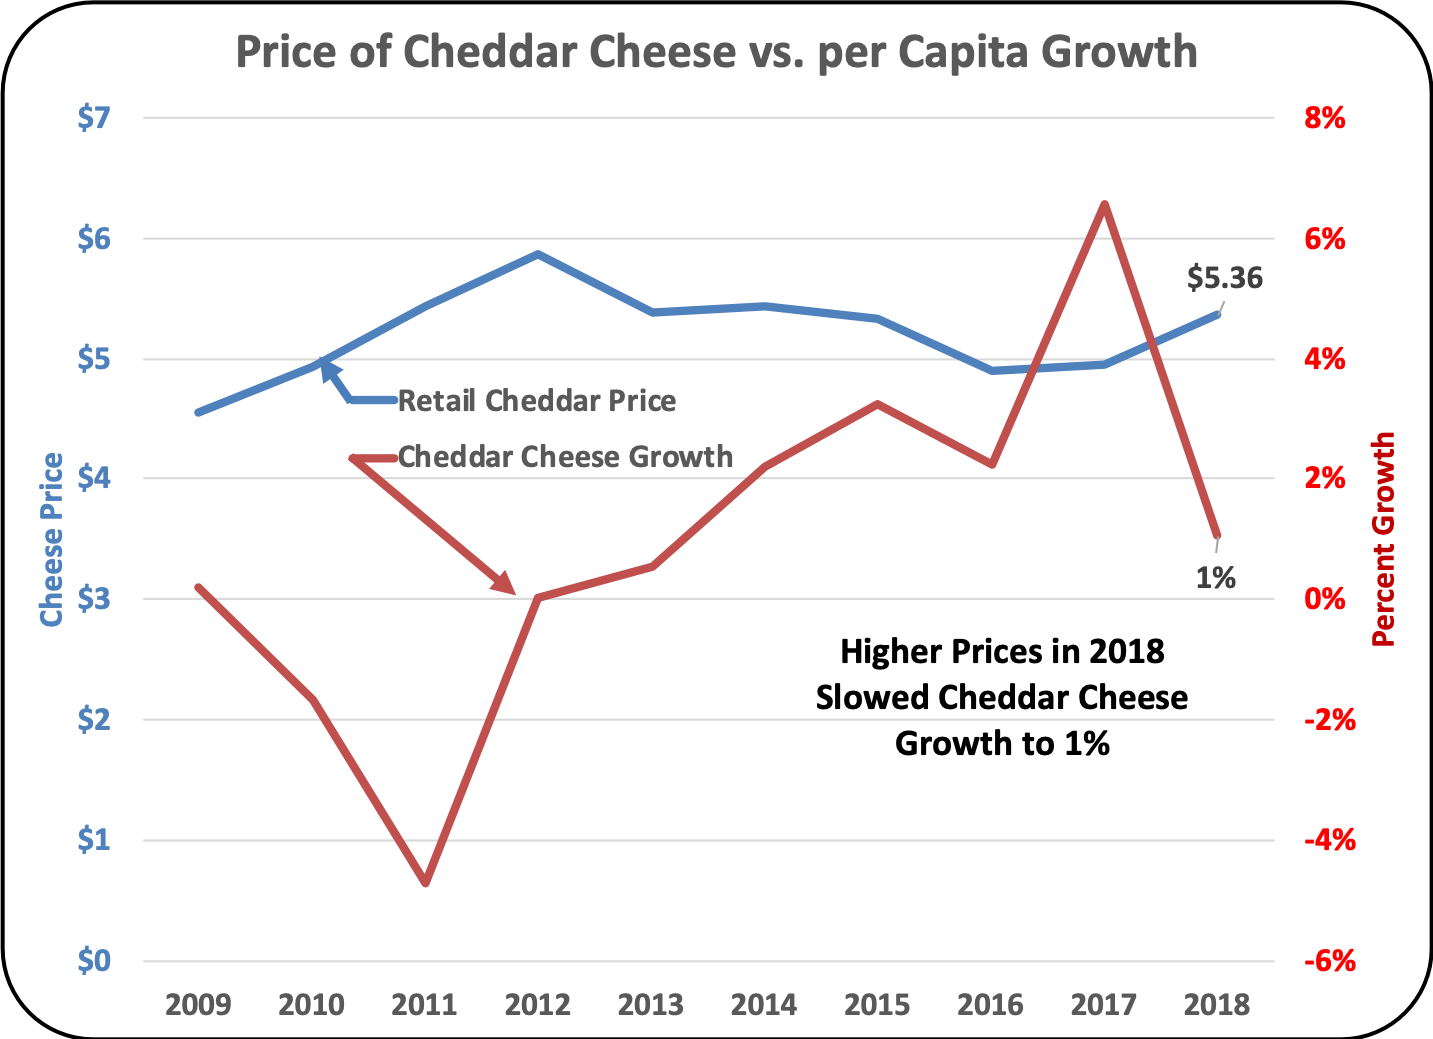 |
| Chart V – Cheddar Cheese Price Elasticity of Demand |
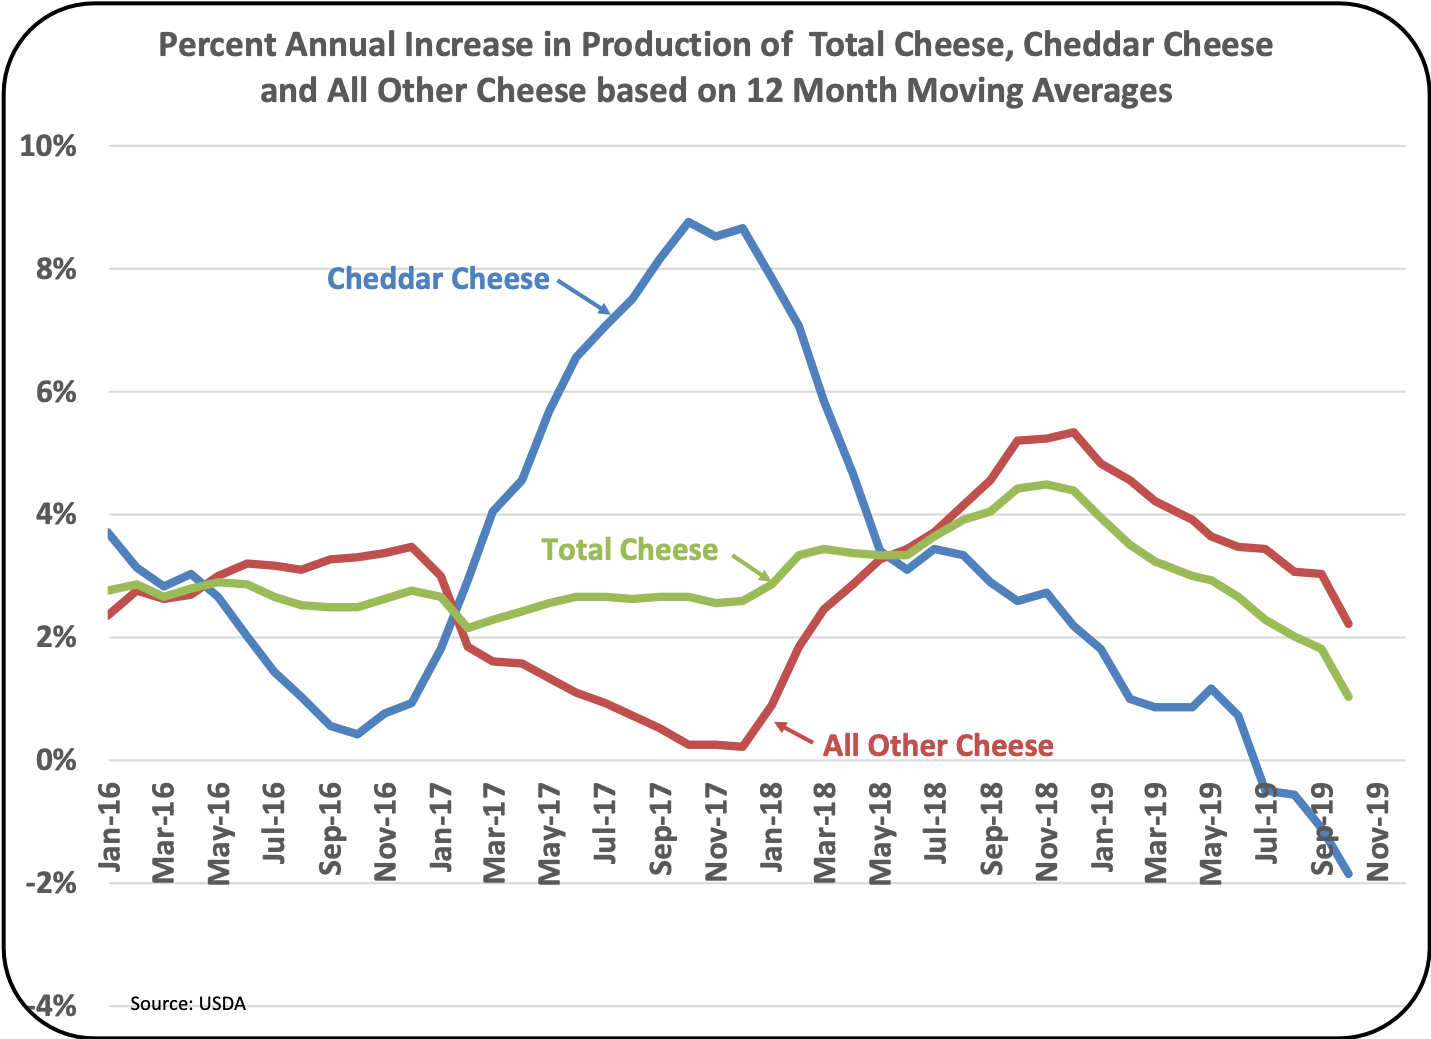 |
| Chart VI – 12 Month Average Growth in Cheese Production |
November Class and Component prices were just released. Class III milk is at $20.45/cwt. and milk protein is at $3.91 per pound, three times higher than the prior year! Yes, milk protein has increased from $1.34 per pound in November 2018 to $3.91 per pound in November 2019!
The rapid increase in milk prices is driven by the blue line in Chart VII. Cheddar production has taken a major dive during 2018 and 2019. In early 2018, the annual growth rate of Cheddar cheese production was near eight percent. In October 2019 it was near a negative two percent growth vs. the prior year. Although data on Cheddar cheese inventories is not publicly available, changes in production obviously drives changes in inventories.
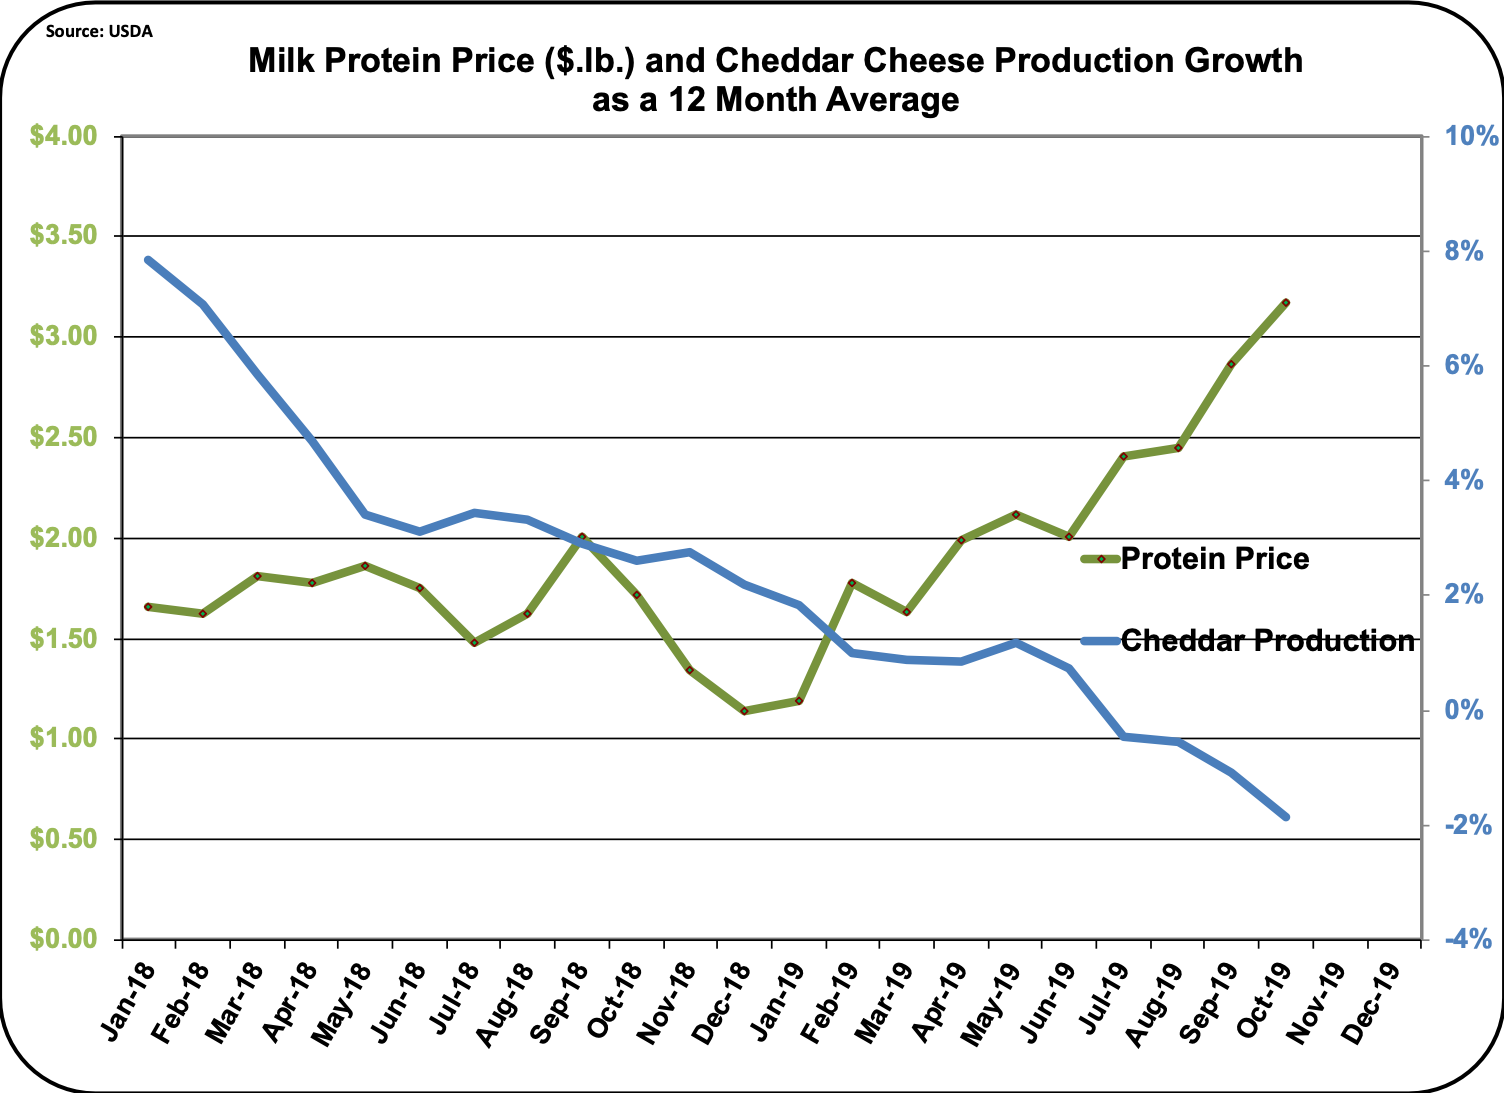 |
| Chart VII – Protein Price vs. Growth in Cheddar Cheese Production |
What does this mean for 2020? If Cheddar cheese production stays low and therefore Cheddar cheese inventories do not grow, milk and component prices should remain very positive in 2020.
Editor’s Note: John Geuss is a dairy consultant based in Florida. This information appears in his Milk Price blog column sponsored by Addiseo and is published here with permission. He may be contacted at johngeuss@gmail.com

Be the first to comment