
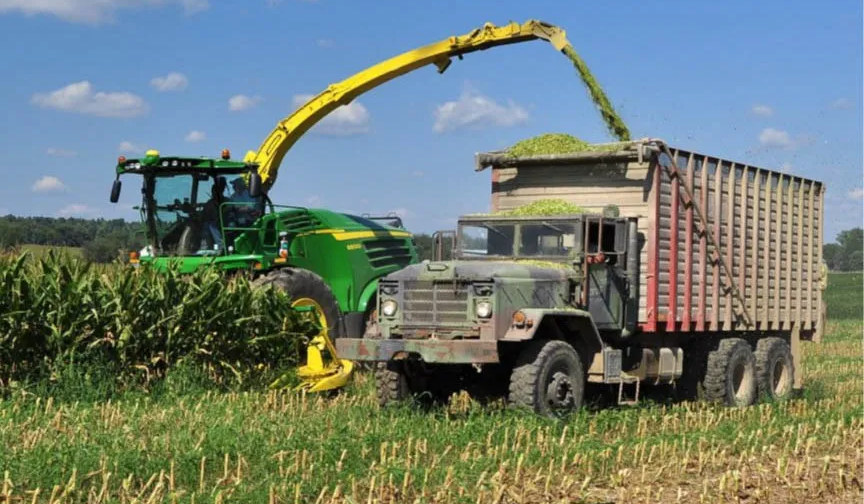
A weekly check-in on silage crop moisture progression at several locations across Pennsylvania.
Accumulated Growing Degree Days (GDD): A measure of the accumulated growing degree days counted at this location since planting. Calculated using 86/50-degree cutoffs.
Precipitation Deviation: A measure of this location’s departure from the 10-year precipitation average, calculated by subtracting rainfall from planting to current date from the 10-year average.
Growing Degree Day (GDD) Deviation: A measure of this location’s departure from the 10-year GDD average, calculated by subtracting GDD accumulation from planting to current date from the 10-year average.
| County | Hybrid | Planting Date | Sampling Date | Moisture Content | Accum. GDD | Precip. Devia. | GDD. Devia. |
|---|---|---|---|---|---|---|---|
| Bedford | P08133 BMR | 5/3/24 | 8/26/24 | 58.40% | 2186 | -0.65” | +91 |
| Bedford | P1380 | 5/3/24 | 8/26/24 | 69.30% | 2186 | -0.65” | +91 |
| Berks | SC1112Q | 5/22/24 | 8/26/24 | 72.00% | 2254 | -6.95” | +30 |
| Centre | – | 6/7/24 | 8/26/24 | 76.96% | – | – | – |
| Franklin | CH210-98 | 5/22/24 | 8/27/24 | 72.00% | 2314 | -2.46” | +40 |
| Lancaster | P0157AM | 5/1/24 | 8/22/24 | 60.75% | 2589 | -4.51” | +8 |
| Lebanon | P1380 | 5/22/24 | 8/22/24 | 72.79% | 2208 | -5.13” | -35 |
| Lebanon | SW6790VT2 | 4/23/24 | 8/22/24 | 62.67% | 2639 | -5.03” | +90 |
| Lebanon | Regen Ag | 5/22/24 | 8/22/24 | 73.54% | 2589 | -5.13” | -35 |
| Wayne | FS Invision | 5/26/24 | 8/26/24 | 75.00% | 1746 | +0.36” | +78 |
Depending on your local precipitation and growing degree day accumulations, corn silage harvest could arrive sooner than previous years. Be sure to monitor field conditions and test moisture levels to determine the current moisture level of your corn crop. The average daily dry-down rate for silage is about 0.5% of moisture loss per day, with rates ranging from 0.0-1.0% in extreme weather conditions. In our observations, average daily dry-down rates ranged from 0.1% to 1.1% of moisture loss per day. Some locations, notably in Lebanon and Lancaster, saw a decrease in dry-down rates, while most other locations saw an increase or no change in dry down rates from the previous week.
Over the past week, temperatures decreased from the trends we saw earlier this summer. Pollination success and disease pressure is variable among locations. Although recent storms have brought welcome (or excessive) rains to many parts of the state, precipitation will not affect fields that were poorly pollinated or suffered serious drought stress earlier in the season. If cool weather conditions persist, daily growing degree day accumulations could drop by 50% and could prolong the dry-down period in fields that were not maturing early from drought. For an explanation of how growing degree days affects corn silage maturity progression, see Corn Silage Approaching Maturity – Moving Past Thumb Rules.
| Structure | Whole-Crop Moisture % |
|---|---|
| Horizontal Silo | 65-70% |
| Conventional Upright | 63-68% |
| Oxygen-Limiting Upright | 55-60% |
| Bag | 60-70% |
| Pile or Stack | 65-70% |
For a comprehensive review of best management practices for harvesting, storing, and feeding silage, please see From Harvest to Feed: Understanding Silage Management


Be the first to comment