Is It a Good Year for Dairy? YES!

John Geuss

The post below covers the volume trends for seven key analytics of the dairy industry.  All charts cover the last five years and are calculated as 12-month moving averages to best display trends.   How is the U.S. dairy industry doing in 2025?  GREAT!
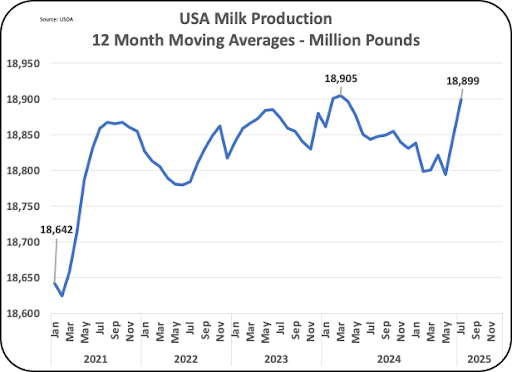
This post will start with milk production (Chart I). The current volume of 18,899 million pounds per month is at record levels.  (In Charts II & III, the compounding impact of higher component levels will be covered.)

Chart I – U.S. Production of Milk

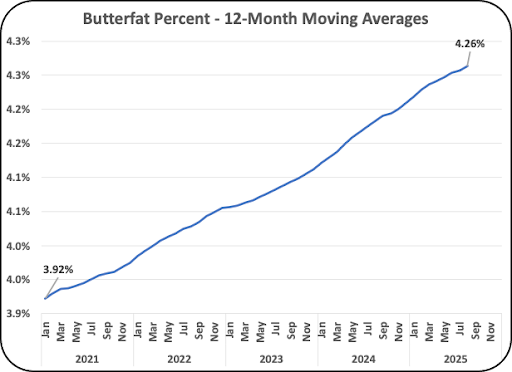
Chart II covers the butterfat in milk.  The chart shows a very steady increase over the last five years.  Improving butterfat content is the producer’s best way of increasing revenue and everyone involved has done an amazing job.   Over the span of Chart II butterfat content has increased by 9%.  All producers can benefit from this.

Chart II – Butterfat Percent Average for Federal Order Milk

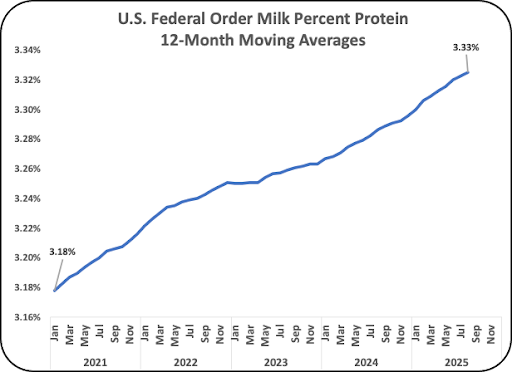
.Chart III shows the steady increases for milk protein.  Milk protein has value for Class III milk only which makes up about half of the total milk.  It has increased by 5% over the span of Chart III.  This percent is measured for total Federal Order milk.

Chart III – Protein Percent Average for Federal Order Milk

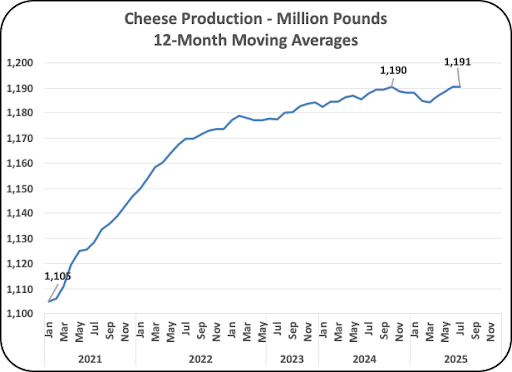
Chart IV displays the increase in cheese production.  Over the five years in the chart, cheese production has increased by 8%.  The current level is a record 1,191 million pounds per month.

Chart IV – Total U.S. Production of Cheese


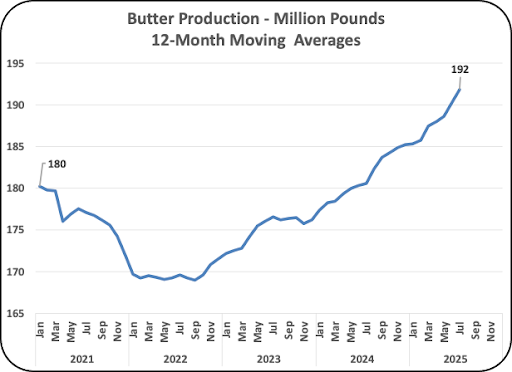
Butter production has increased by 7% as domestic consumption has made steady increases and the trends indicate a continuance of these increases (Chart V).  The increase can be attributed to a changing image recognizing the health benefits of dairy products.

Chart V – Total U.S. Production of Butter

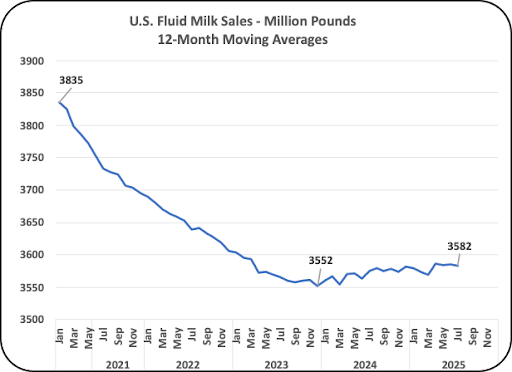
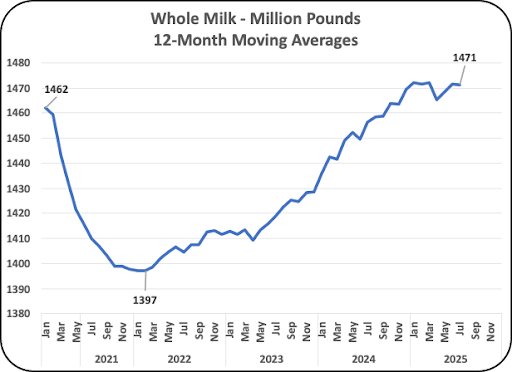
After decades of shrinking consumption, fluid milk consumption is no longer shrinking, it’s growing (Chart VI).  And the volume of milk consumed has not just grown, that growth is coming from whole milk with 3.5% butterfat (Chart VII).

Chart VI – U.S. Fluid Milk Sales
Chart VII – U.S. Sales of Whole Milk

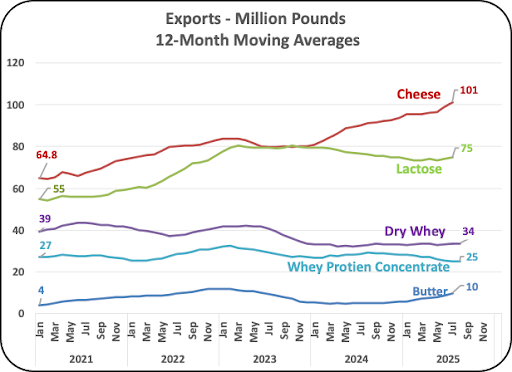
Exports are showing growth!  Chart VIII shows the growth for five major dairy categories.  In total, they represent a 29% increase over the last five years.  Cheese exports have grown by 55% and now makes up over 40% of the U.S. dairy exports.

Lactose exports have increased by 36% but have had no growth over the last two years.


Dry whey and whey protein concentrate have had small declines. Butter exports have doubled but still represent a very small portion (about 4%) of U.S dairy exports.

Chart VIII – Exports of U.S. Produced Dairy Products

SUMMARY

Who are the heroes of the above achievements?  While thousands have contributed to this success there are three that stand out.

  1. First are the many professionals, managers, and those that made it happen that worked to increase the butterfat and protein levels in milk.  Today’s dairy products require these components.
  2. The increase in cheese exports of 55% is amazing.  U.S. cheeses are amazing and can compete with European cheeses.
  3. The recognition that dairy products have health benefits has helped.  The dairy industry could certainly use some new marketing and advertising to further promote the health benefits of dairy products.

Editor’s Note:  John Geuss is a dairy consultant based in Florida. This information is originally published on Milk Price blog,  https://milkpay.com/blogspot/ , sponsored by Adisseo and is published here with permission.  He may be contacted at johngeuss@gmail.com

Originally published at https://milkpay.com/blogspot/

Be the first to comment

Leave a Reply

Your email address will not be published.


*