

Another U.S. cheese export record, ongoing U.S. butterfat strength and an improved month for NFDM/SMP lead to best October since 2022.
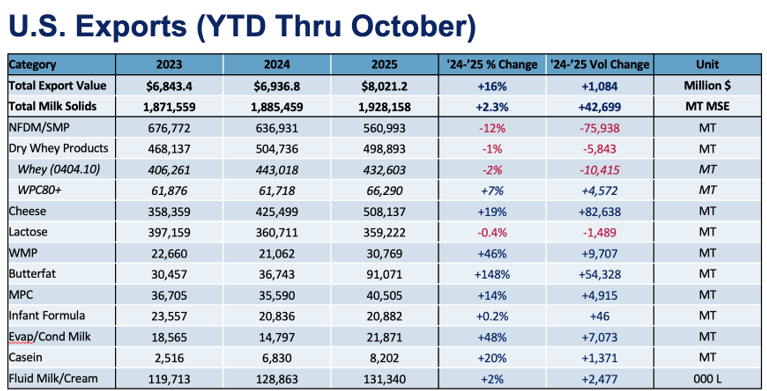
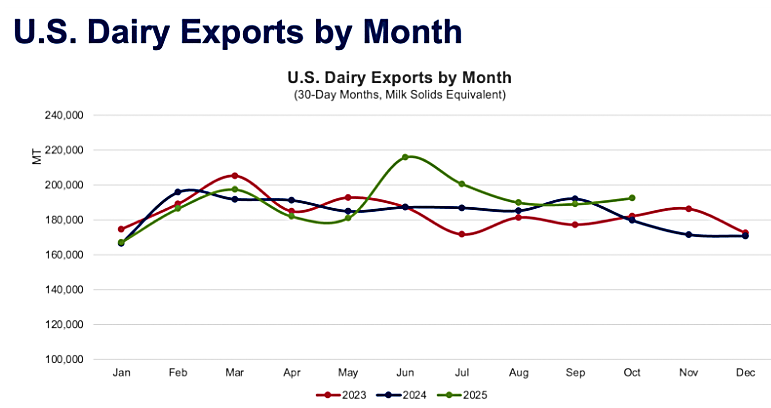
Year-to-date (YTD), U.S. dairy exports were up 2.3% MSE through October, and U.S. suppliers have grown YOY volume in four of the previous five data months. In value terms, YOY U.S. dairy exports jumped 17% to $837.1 million for the month, lifting YTD value to more than $8 billion.
Several high points
The positives in U.S. trade data in October were plentiful. U.S. cheese exports established a new monthly record: 55,060 MT. YOY volume grew 36% (+14,526 MT) with gains to nearly every major market (see the deeper dive below for more detail on cheese). U.S. suppliers have set a new bar after six consecutive months of more than 50,000 MT of cheese exports.
Butterfat continued to roll as well. YOY U.S. butter exports soared 170% (+4,650 MT), with gains to the Middle East/North Africa (+1,581 MT), Canada (+1,346 MT) and Australia (+642 MT). October marked six straight months in which U.S. butter shipments have more than doubled. YOY anhydrous milkfat (AMF) volume rose “only” 75%, led by Mexico (+774 MT) and Australia (+433 MT).
We also saw sizable gains from whole milk powder (+121%, +1,748 MT) and milk protein concentrate (+43%, +1,387 MT). Even nonfat dry milk/skim milk powder (NFDM/SMP) showed some signs of life in October. For the first time in five months, YOY NFDM/SMP exports grew. The gain was less than 1% (+213 MT), but compared to the average 17% monthly decline from July through September, it was a welcome change.
Whether that increase is a signal that more growth is imminent is another story. YOY NFDM/SMP volume to our biggest customer, Mexico, fell 16% (-6,267 MT) in October. Over the three months ending October, U.S. NFDM/SMP exports to Mexico plunged 18% (-20,167 MT).
While YOY shipments to our No. 2 market, Southeast Asia, rose 13% (+1,744 MT), the increase came against a poor October 2024 performance. Most of October’s growth originated from uncharacteristic sources: A more-than-2,000% spike in sales to Honduras (+3,118 MT) and atypical jumps in volume to Peru (+128%, +1,432 MT) and Colombia (+250%, +1,526 MT).
It’s still early, but recent U.S. and global data provide some optimism on global demand. While milk production continues to surge in the U.S., EU and New Zealand, world dairy trade rose for three straight months (including a hefty 5.2% in September).
For more detailed information, as well as interactive charts and data, visit USDEC’s Data Hub.
Cheese exports impress once more
Exceptional has become the new normal for U.S. cheese exports this year. In four out of the ten months for which export data is available in 2025, cheese exports set a new record, including the most recent release of October results. Compared to the prior year, October cheese exports grew 36% (+14,526 MT). This brought 2025’s year-to-date cheese exports within 655 MT of the 2024 full-year total, which was record-setting at the time. With two months still outstanding, it is safe to say that 2025 was a year for the history books in terms of cheese exports.
All this cheese is destined for ports and customers across the globe. Exports to almost all major markets were up significantly, except for China/Hong Kong/Macao (-9%, -55 MT) and South Asia (-2%, -0.4 MT). Mexico continues to be the top destination for U.S. cheese and shipments rose again in October (+11%, +1,926 MT). However, Australia holds the title for the largest absolute growth, swelling an impressive 117% (+2,808 MT) and surpassing the 5,000 MT mark for the second month in a row.
Even outside of Mexico, Latin America remains a strong growth market for U.S. cheese exports, as YOY shipments to Central America and the Caribbean grew 32% (+2,069 MT) and cheese bound for South America jumped 70% (+1,044 MT). After a mediocre 2024, Japan (+91%, +2,084 MT in October) and Korea (+29%, +1,320 MT) have reclaimed their place as major sources of growth for U.S. cheese.
Price dynamics in the latter half of 2025 have encouraged U.S. exports of most products, but cheese exports have especially benefitted from the United States’ competitive prices. Despite aggressive pricing from the EU at the beginning of Q4 2025, the U.S. has maintained its price advantage into the new year, which suggests exports should remain positive in the near term. However, global milk production is shaping up to be persistently strong in the coming months, so U.S. cheese exports will likely face stiff competition as the year marches on and market dynamics shift.
Whey a mixed bag in October
October brought mixed results to the whey complex. In aggregate, the data showed modest declines across both high- and low-protein products, but significant nuance appears upon further investigation.
High-protein whey* volumes declined by 1% (-29 MT) year over year in October and posted the weakest performance since February. However, it was only dramatically lower demand from China (-78%, -1,299 MT) that weighed heavily on the monthly figure—performance was decidedly better across other destinations. YOY volumes to Japan jumped by 41% (+338 MT), underscoring the strength of demand—even in the face of moderating economic performance and a weaker yen. Larger exports to Europe (+85%, +305 MT) and South America (+39%, +176 MT) also contributed positively to the total figure.
Price levels of high-protein whey products remain elevated. The average export price of products shipped under the high-protein whey HS code rose to $12,676/MT in October, up $1,300 from the prior month and only about $300 shy of the record high. But with the exception of China, it seems that even these lofty levels have been insufficient to curb buyer appetites amid the global protein craze.
With geographic and economic access to GLP-1s expected to expand during 2026, global high-protein whey demand is expected to remain robust. But only time will tell if prices really can persist at these levels, or even move higher, without denting demand.
Low-protein whey exports also slipped by 1% (-359 MT) in October, though performance varied widely across sub-products. On the negative side of the ledger, exports of whey protein concentrate (WPC) with less than 80% protein sank to 9,453 MT, down 20% (-2,408 MT) compared to the same month last year. Lower shipments in this category are a reflection of decreased domestic production. Cumulative U.S. production of WPCs with between 25% and 50% protein was down 8.6% over the first 11 months of the year as manufacturers pivoted toward higher value ingredients.
Meanwhile, dry whey exports rose 9% (+1,561 MT), extending the gains seen in recent months. Following extreme volatility early in the year, U.S. dry whey exports have found some traction with year-to-date exports leading prior year by 7% (+11,808 MT). Stronger demand from South America, and especially Colombia (+153%, +363 MT) and Chile (+56%, +300 MT), complemented gains in China (+13%, +933 MT) to drive total volumes higher. In addition, modified whey exports were up 4% (+488 MT) underpinned by stronger permeate demand in China.
Whey remains an essential component of the U.S. dairy export portfolio and the subdued headline growth belies many opportunities that exist across certain products and geographies. Looking ahead, while challenges will continue to present themselves, a strong undercurrent of protein demand bodes well for U.S. whey exports into the coming months.
*In order to correct for reporting inconsistencies (made clear by suspiciously low high-protein whey prices to China) and provide a more realistic picture of product flows, USDEC adjusts official whey export data, aligning reported unit values with actual market prices. If you have any questions or would like more information, don’t hesitate to reach out to any member of the Economics team.


Be the first to comment