

The prior post covered the impact of current component levels on producer revenue. The impact is very powerful. This post and the next three posts will cover opportunities to increase revenue. The four posts will cover the following elements.
- Part I – Making Money – Butterfat and Protein Components
- Part II – Making Money – Milk per Cow
- Part III – Making Money – Somatic Cell Counts
- Part IV – Making Money – The Mix of Classes of Milk and the Statistical Uniform Prices
This post will compare component levels in the different Federal Orders and show which Orders have the highest component levels and which are growing component levels fastest. The data is based on 12-month moving averages to eliminate volatility. Because Class II, III, IV can de-pool, Federal Order data is skewed by significant de-pooling. Typically, the highest paid Class has a lot of de-pooling and is not included in the Federal Order numbers. In the last 12 months, de-pooling of Class IV milk has been significant.
BUTTERFAT by FEDERAL ORDER
Table I lists the 11 Federal Orders by the highest butterfat components to the lowest. All Federal Orders are paid for butterfat. The order has not changed significantly in a long time. The Northwest Order continues to maintain the highest levels of butterfat at 4.31%. Florida continues to have the lowest butterfat percent at 3.89%. Both Orders are small, but the .42% spread indicates a very different management approach. At current butterfat prices, the difference is worth $1.50 per cwt.
The four with the lowest butterfat levels are all paid on the Advanced formulas and have significant volumes of fluid milk, the highest paid milk.
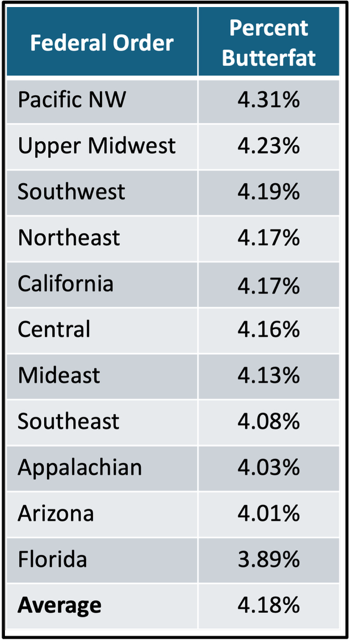
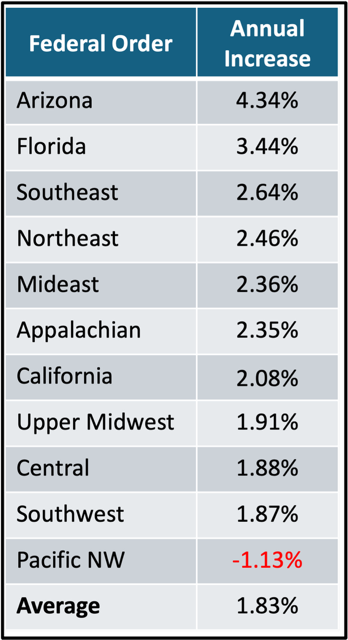
Table II below shows how fast each Federal Order is increasing butterfat levels. Table II rankings are the inverse of the Table I. The Federal Orders with the lowest butterfat levels are rapidly increasing butterfat levels. Money talks! The Northwest Federal Order with the highest butterfat levels had a decrease from the prior year. Even with the butterfat increases in the Federal Orders paid on the Advanced system, they are still at the bottom of the Table I listing.
PROTEIN by FEDERAL ORDER
WHAT DOES IT ALL MEAN?
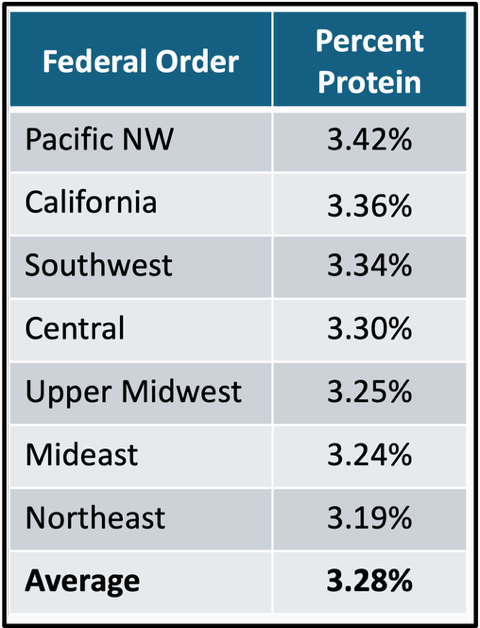
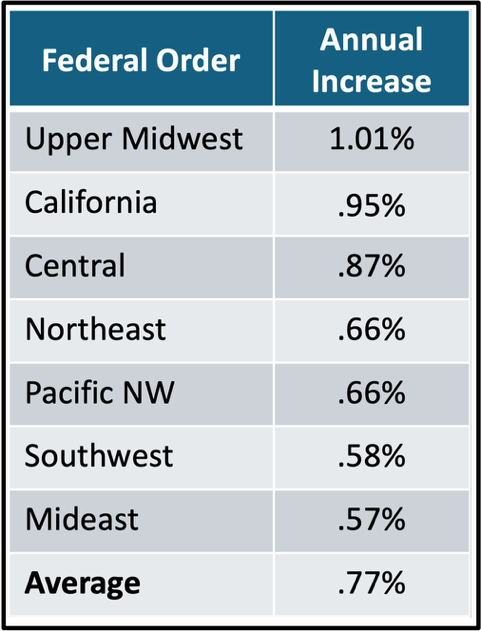
The tables above are based on averages of many herds and many cows. While data is not available at the herd and cow level, the statistical variance would be much greater. Having a higher protein level benefits cheese producers and it also increases the producer revenue. All producers in the Federal Orders paid on the Class and Component formulas benefit financially from higher butterfat and protein component levels.
Using the tested and verified sciences to increase component levels is available to all. Why would any producer not utilize these tools to increase revenue?

Be the first to comment