
Given current market conditions, it’s valuable to understand patterns in agricultural input prices to protect farm profitability.
Fuel and fertilizer are key inputs for crop production. As we approach harvest, it is valuable to start thinking ahead to the next crop year. Fertilizer is a major expense category for many farmers, and the recent volatility in the fuel and fertilizer markets have important financial implications. Based on data from FINBIN, from 2006 to 2025, fertilizer expenses accounted for 16% to 25% of total expenses for corn production. It is the second largest production expense, following land rent. Given tight margins in commodity production, finding strategies to manage expenses is increasingly critical and can serve as a risk management tool, supporting the financial position of farms.

Fuel is a Varying Expense
Current diesel prices are hovering around $4.50/gallon, which is up more than $1.50/gallon from 2024 and 2025 prices. This increase in relative terms is quite large, but what is the impact on your farm? Diesel fuel usage per hour is often estimated as engine horsepower multiplied by 0.044 (HP x 0.044). A 125-horsepower tractor would use approximately 5.5 gallons of fuel per hour at rated engine speed. When coupled with an implement that covers 8 acres per hour, the fuel cost is minimal (5.5 gallons at $4 per gallon, divided across 8 acres equates to a fuel cost of $2.75 per acre). Therefore, a $1.50 per gallon increase in diesel fuel prices would result in a $1 per acre increase in operating costs. However, where you are likely to see larger impacts is in the transportation and hauling of inputs and commodities, often accounting for the major fuel-related increases in total production costs.

Current Fertilizer Price Status
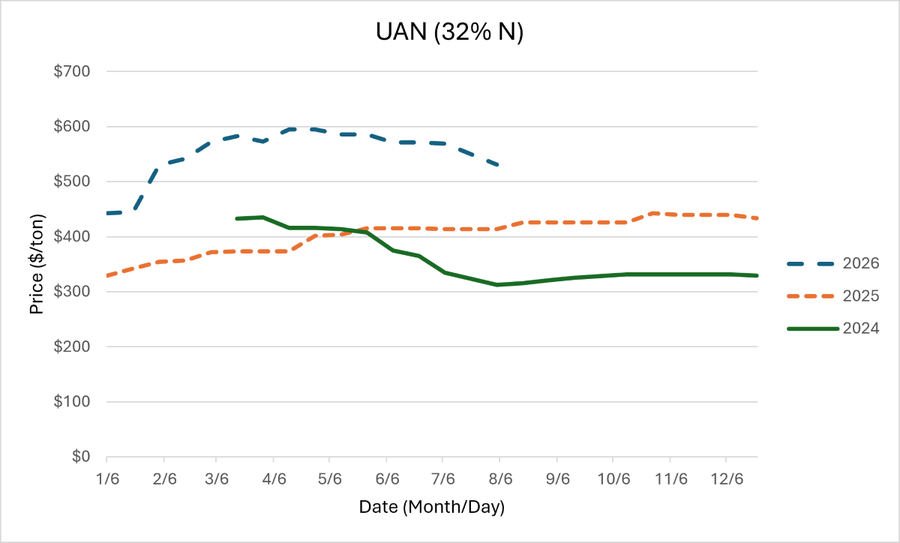
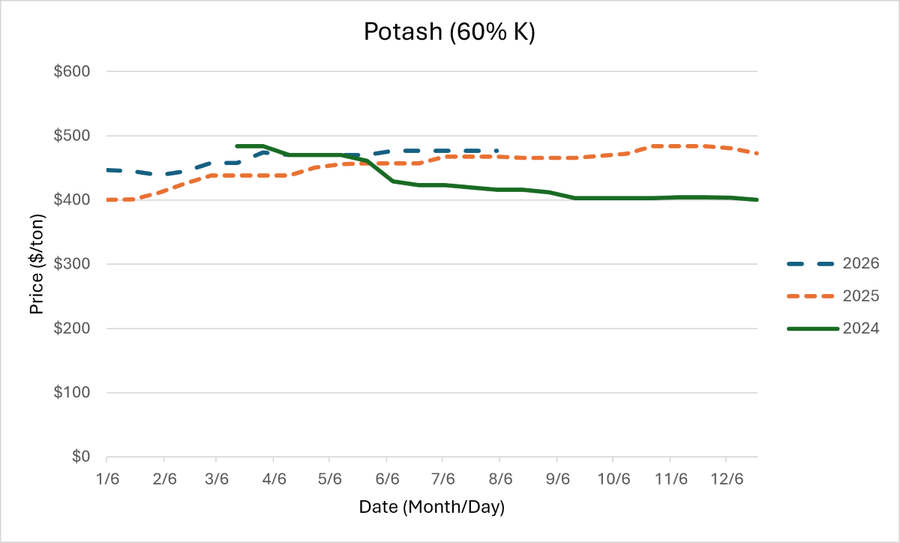
Prices for UAN, urea, and potash were collected from USDA-AMS Pennsylvania Production Cost Report and are shown in Figures 2-4. One common theme emerges among these figures – nitrogen prices in 2026 have been higher relative to 2025 and 2024 prices, putting additional pressure on already tight farm margins/p>
The most noticeable price changes are with liquid UAN, where prices climbed all throughout 2025 and into mid-year 2026. We have seen some slight decreases over the last month, but the overall difference in prices over the time period has been substantial. Liquid nitrogen prices started 2025 at approximately $330/ton and climbed more than $100/ton across the year, ending 2025 around $434/ton. Unfortunately, this trend did not stop there, and prices continued to climb, reaching a weekly average high price of $595/ton in mid-May 2026. It has dropped to around $530/ton currently, but a key consideration is what price expectations are over the next few months, and how to mitigate the possibility of potential price increases in months to come.
Potash, on the other hand, has had fairly stable prices, which have been in line with prices for the past two years. The average weekly price has hovered around $470/ton for much of 2025 and 2026. Concerns over retaliatory tariffs on imports from Canada could include fertilizer potash – recent estimates from The Fertilizer Institute claim that 85% of potash purchased in the U.S. is sourced from Canada1. Addressing potash needs in the short term could be an important tactic to reduce risk from price fluctuations.
Looking Ahead
Now is the time to start thinking ahead to the 2027 growing season. A combination of agronomic and economic best practices includes:
- Treat fertilizer needs as a risk management strategy, similar to how you might use forward contracting for commodity sales. If current or projected fertilizer prices are close to historical lows, it may be reasonable to pre-order or pre-purchase some of your fertilizer needs.
-
Remember that when applied properly (via split applications and minimizing volatilization), there is no agronomic advantage to liquid UAN compared to granular urea – ease of handling and price per unit of nitrogen are the chief advantages of one versus another. Proper calibration of broadcast spreaders or sprayer nozzle selection is essential to minimize overapplication.
- For livestock operators producing small grain or corn silage, reducing your liability towards fertilizer fluctuations is an important feed cost management tactic – a $15 per ton reduction in forage production costs translates to a $0.15 per head per day reduction in feed costs (assuming an as-fed inclusion of 20 pounds of forage).
- Utilize strict soil sampling intervals and cropping records to establish fertility requirements by crop yield potential. Properly accounting for soil fertility levels and manure nutrient utilization can minimize, if not eliminate, commercial fertilizer purchases.
The charts and market summaries presented reflect market reports from the United States Department of Agriculture – Agricultural Marketing Service (USDA-AMS). A direct link to the bi-weekly updates can be found online. Biweekly reporting for Pennsylvania began on April 15th, 2024.
1TFI Statement on Implementation of U.S. Tariffs on Imports of Canadian Potash and Other Fertilizers. The Fertilizer Institute, March 4, 2025. Accessed September 3, 2026.



Be the first to comment