

The information provided in this analysis report of California’s Low Carbon Fuel Standard (CA LCFS) Carbon Intensity (CI) score applied to biomethane or renewable natural gas (RNG) produced from dairy manure anaerobic digestion (AD) located on a New York (NY) State dairy farm can be used to understand the different CI score components and relative importance of them, as well as the opportunities to improve the score, total greenhouse gas (GHG) reduction, and revenue. As NY begins to implement its Climate Act Scoping Plan1 , consideration of its own transportation fuel standard would allow for RNG end use within the state (avoiding the substantial GHG emission associated with lengthy pipeline transport that the CA LCFS participation includes) and would apply the 20-year global warming potential (GWP) to CH4 emissions (84 times CO2). The latter alone results in a CI score of negative 525 g CO2e per MJ, yielding three times more GHG reduction opportunity (approximately 33,000 MT CO2e per year), for this 3,000-cow dairy AD-to-RNG for transportation fuel example.
Background
The carbon intensity (CI) score is used to appropriately value a unit of transportation fuel under California’s Low Carbon Fuel Standard (CA LCFS) policy. The California Air Resources Board (CARB) established a LCFS program in 2011 as part of the measures put in place to achieve greenhouse gas (GHG) reductions in CA of 20% by 2030 and 80% by 2050. This LCFS program provides an opportunity for dairy farms across the country to monetize the production of pipeline quality RNG delivered via a theoretical path to CA from captured biogas generated from the anaerobic digestion (AD) of dairy manure.
The CI score quantifies the life cycle GHG emissions per unit of transportation fuel energy produced so that an appropriate monetary value can be applied. The CI is calculated using the CA-GREET3.0 model, which is applied in a set of Tier 1 fuel pathways that each have a simplified CI calculator offered by CARB. The Tier 1 Simplified CI Calculator for Biomethane from Anaerobic Digestion of Dairy and Swine Manure (herein referred to as Tier 1 CI Calculator) is a downloadable Microsoft® Excel® spreadsheet2 that can be useful for project planning purposes and was referenced in the
Unlike dairy farms in New York (NY) State, California dairies typically use flushing systems to move the manure from lanes where the cows have deposited manure into anaerobic lagoons specifically designed to reduce the volatile solids (VS) and thereby releasing significant methane (CH4). The typical solution is to cover the lagoons to capture and utilize the CH4. Covered anaerobic lagoons are not heated due to the warmer climates they are designed for, but do require a solids removal system prior to the lagoon to avoid solids build up under the cover. The anaerobic lagoons can have a long hydraulic retention time (HRT) and since the growing season in CA is approximately 10 months, the digested effluent storage can be minimal.
New York’s climate makes an anaerobic lagoon unfeasible. Dairy farms in NY typically store raw or separated liquid manure in manure storages that are substantially emptied twice (or more) per year for field application according to nutrient management plans. Manure storages are not always drawn down completely and remaining sludge is rarely removed. Although not designed to facilitate VS degradation, CH4 is produced from manure storages particularly in the warmer months. The anaerobic digesters used to capture CH4 from manure in NY are typically enclosed vessel structures with a relatively short HRT (days not months) and require heating to steadily convert VS to CH4 in this period.
Terminology
Baseline Methane Emissions: The “baseline” condition for a dairy farm refers to its historical manure management/treatment systems, and specifically those that release methane. These systems will be replaced either in full or in part by the “project” biogas control system (see definition below). It is ultimately CARB’s decision what constitutes the historical baseline (i.e., how many years the system(s) have been used). Note: dairies with existing anaerobic digestion of manure have had the baseline condition that existed prior to the digester installation accepted by CARB.
Biogas Control System (BCS): The BCS is considered to be the “project”, typically an anaerobic digester, that is installed to capture and ultimately destroy the methane in biogas produced from livestock manure. The BCS replaces all or part of the baseline manure management/treatment systems.
BCS Effluent Pond: Where the effluent liquid from the BCS is held. This is assumed to be the uncovered long-term storage of liquid/slurry after anaerobic digestion has occurred.
Biomethane: Often referred to as renewable natural gas (RNG), it is the upgraded methane derived from biogas (the raw gas primarily comprised of methane and carbon dioxide generated from anaerobic decomposition of organic matter) that meets vehicle or pipeline standards.
Upgrading: Refers to the conditioning of raw biogas to produce biomethane by removing unwanted compounds (i.e., hydrogen sulfide, water, and carbon dioxide) and compressing the gas to the desired pressure for compressed natural gas (CNG) vehicle fueling, direct pipeline injection or truck transport to pipeline injection point or CNG fueling station.
Carbon intensity (CI) score components
The baseline GHG emissions that are replaced by the project’s reduced GHG emissions contribute to the CI score. Baseline GHG emissions will be negative if they are offset by the project. GHG emissions associated with the project will be positive. Typically, and ideally, the baseline emissions are greater in magnitude than the project emissions, yielding a net negative CI score. The CI score is computed in units of grams of carbon dioxide equivalent (g CO2e) per megajoule (MJ) of net fuel (biomethane) produced by the project.
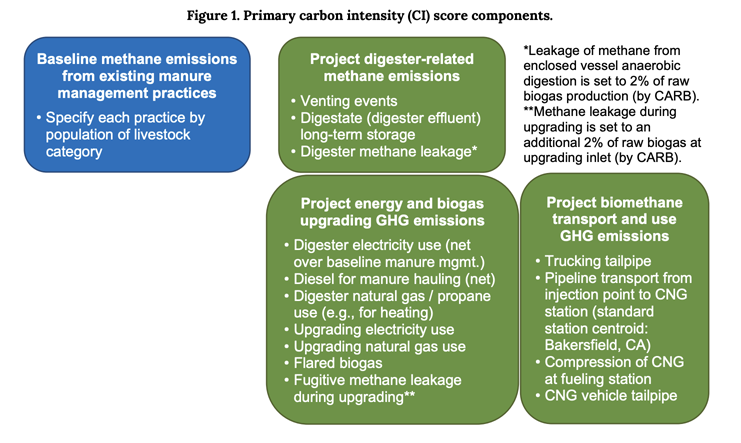
Example CI score for a New York State dairy
An example CI score was computed for a New York State dairy located near Ithaca, NY with 3,000 lactating cow equivalents (LCE) that replaces the baseline practice of long-term storage of raw manure with manure anaerobic digestion (enclosed vessel type) to biomethane production for CNG vehicle fuel. The dairy’s entire herd can be expressed in LCE units by equating the volatile solids (VS) in the manure from dry cows and heifers to the VS in a lactating cow’s manure and summing up the total in terms of lactating cow manure VS content. The Tier 1 CI Calculator accommodates adding multiple livestock categories if desired, which is also more accurate. The digester biogas to biomethane upgrading system in this example is assumed to be a dual membrane type with a 95% methane (CH4) recovery efficiency. Product biomethane is injected into the local utility natural gas pipeline and transported to the California standard CNG fueling station centroid (2,670 miles).
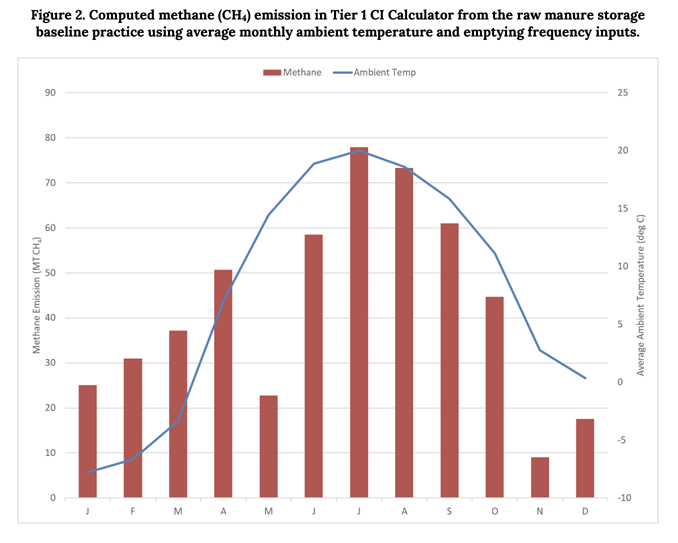
- Baseline methane emission from existing manure management Baseline CH4 from anaerobic storage/treatment systems is computed monthly from data entered in the “Manure-to-Biogas” tab (section L1). Key inputs include livestock group population, average ambient temperature, and retention/drainage time. Using the monthly average ambient temperature near Ithaca, NY and assuming the storage is completely emptied once by the end of April and once by the end of October for field application, the total 12-month period baseline CH4 emission calculated is 508.7 MT. Importantly, the retention time and drainage input options are either “not applicable” or “retention time less than 30 days”/”system emptied”, defined as complete drainage and cleaning of solid buildup from the anaerobic storage/treatment system. Selection of “system emptied” results in the remaining VS in the storage to be set to zero. In fact, standard emptying of manure storages for field application in the spring and often in the fall may not include complete draining and cleaning of solid buildup, leaving behind some VS, however the conservative selection of zero VS remaining after these events has been used for the baseline CH4 calculation in this analysis. Figure 2 shows the average ambient temperature input and baseline raw manure storage CH4 emission by month.
- Project methane emissions from venting events
It is assumed that there are no venting events that occur from the BCS (project). Venting events are considered separately from the possibility for continuous CH4 loss or leakage from the system. These events would not normally occur unless necessary.
- Project methane emissions from the BCS effluent pond (storage)
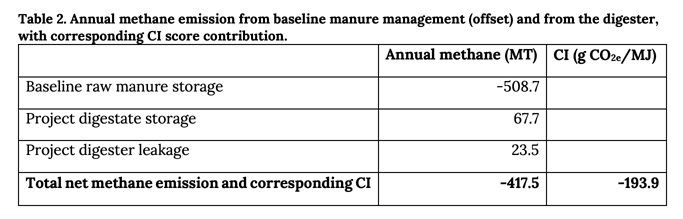
For this example, it is assumed that the digester effluent is routed directly to long-term storage. The Tier 1 CI Calculator does not accommodate post-digestion effluent solid-liquid separation (or other digestate treatments). Many farms in NY do separate the digestate into separated solids, often used for animal bedding, and separated liquids that are stored long-term. Separation reduces the VS content in the separated liquid4 , and thus can impact the estimated CH4 emission from the anaerobic long-term storage of the BCS effluent. Calculated BCS effluent storage CH4 uses the average annual ambient temperature input (“Biogas-to-RNG” tab), resulting in 67.7 MT per year.
- Biomethane production and system energy usage data
A minimum of 3 months of BCS operating data is required for the CI score to compute. It is assumed that the system would operate similarly throughout a full year in this example. Annual average values were used for the digester heating load for the 3 months entered.
4.1. Raw biogas production, digester leakage, and biogas to cleanup/upgrading
Raw biogas production from the digester is estimated assuming 90 cf/day per LCE and 60% CH4 content5 . Digester leakage is computed from these inputs using a default value of 98% biogas collection efficiency for an enclosure vessel digester (Tier 1 CI Calculator Reference Table A.3.), which equates to about 23.5 MT per year. The raw biogas production estimated is also used as the raw biogas amount at the inlet to the cleanup/upgrading process. Additional CH4 loss through that process is accounted for in the CI score “Feed loss (fugitive methane)”, which applies a default value of 2% fugitive CH4 emission from the biogas upgrading process (Tier 1 CI Calculator EF Table). This equates to another 23.5 MT of CH4 emission from the BCS per year.
4.2. Energy use of baseline manure management, digester, and biogas upgrading
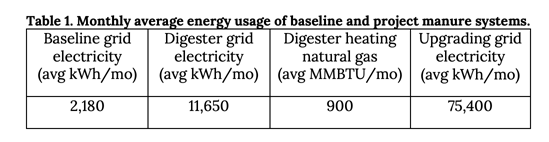
Baseline energy use is assumed to be grid electricity for pumping manure to long-term storage. For the project, digester energy use includes grid electricity and utility sourced natural gas for heating. Digester grid electricity usage is estimated assuming the manure will need to be pumped to the digester (equal electricity as baseline usage), the digester is mixed, and the effluent is agitated and pumped to long-term storage. It is assumed the digester is heated using an 81% efficient hot water boiler fueled with utility natural gas (NG) with an annual average heating demand of 1 million BTU (MMBTU)/hr. Finally, biogas upgrading to biomethane is estimated to consume approximately 100 kW per hour for the 200-cfm capacity system that aligns with this example biogas production rate. Monthly average energy usage values assumed are reported in Table 1. Grid electricity mix is selectable based on the project location; NYUP is used for upstate NY.
4.3. Biomethane injected into pipeline and flared gas (including tailgas)
The product biomethane that is injected into the pipeline after upgrading must be entered and was estimated to be 98% of the raw biogas at the upgrading inlet (to reflect the 2% loss) with a 95% CH4 recovery efficiency, equating to an average of 4,720 MMBTU/mo or 53,846,300 MJ/year. The Tier 1 CI Calculator includes a default emission profile for flaring biomethane and applies it to the upgrading tailgas, or separated carbon dioxide (CO2) stream, that occurs during the membrane CH4 recovery process. With a 95% CH4 recovery, the tailgas is estimated to have about 7% CH4 content and 75 cfm flow rate.
- Biomethane transport and end use
With pipeline injection of the product biomethane, it is assumed to be transported via pipeline to the end use CNG station in California. Unless a specific station is known, the centroid of available CNG stations has been defined as near Bakersfield, CA and pipeline transmission distance may be computed using driving mileage. For this example, 2,670 miles of total pipeline transport distance was entered for the upgrading facility in central NY to Bakersfield, CA. This mileage and the total product biomethane are used to compute both CO2 emissions and CH4 loss emissions associated with pipeline transmission.
The end use of the biomethane is to fuel CNG vehicles in California and the emissions associated with electricity usage for compressing the biomethane in the fueling station as well as the tailpipe emissions of the CNG vehicle itself are also included in the CI score. The CI for CNG station compression energy is hard-keyed as 3.5 g CO2e/MJ. The CNG vehicle tailpipe emissions include unburnt CH4, nitrous oxide (N2O), and CO2 from a reference table within the Tier 1 CI Calculator. These are each shown in the table in section 6.
- CI score breakdown
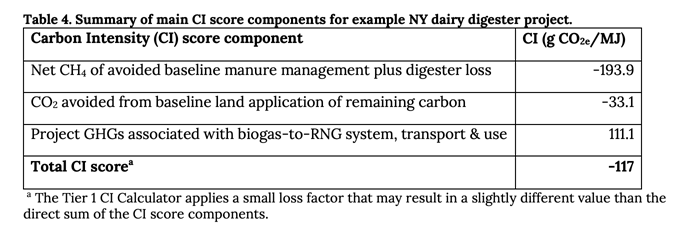
All of the components discussed in sections 1 through 5 are compiled to compute the CI score for the biomethane for CNG vehicles produced from AD of dairy manure project. First, the net CH4 emission of the avoided baseline and the project digestate storage and digester vessel leakage is computed and expressed in units of CO2e per energy unit of product biomethane (MJ) using the 100-year global warming potential (GWP) values from the IPCC AR4 (i.e., 25 for CH4 and 298 for N2O). Table 2 summarizes the CH4 offset and digester related CH4 emissions that yield a net CH4 emission and corresponding CI score contribution.
The Tier 1 CI Calculator includes the avoided emission of carbon that was not converted to CH4 in the baseline manure management case by subtracting the CH4 produced by the digester from that produced in the baseline raw manure storage, and assuming the net carbon content would have oxidized to CO2 when land-applied in the baseline case. For this example, this avoided CO2 emission is computed within the calculator as negative 33.1 g CO2e/MJ.
Table 3 details the project’s biogas-to-biomethane emissions including RNG transport and end use GHG emissions accounting based on the inputs used in section 4 and section 5 above.
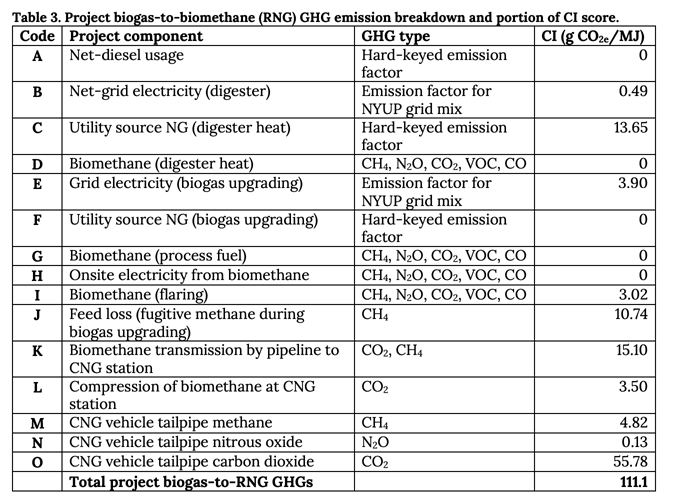
The total CI score for the example is then the sum of the net methane avoided, the land application CO2 avoided, and the project biogas-to-RNG system emissions, as summarized in Table 4 below. Total GHG emissions associated with the RNG production are therefore net negative 6,300 MT CO2e per year using the product biomethane quantity for this example of 53,846,300 MJ per year.
Analysis of project scenarios
The following project scenarios were analyzed by manipulating the Tier 1 CI Calculator to see the impact on the CI score, as well as the total annual GHG emissions reduced and estimated revenue from California LCFS credits and D3 RINs (RIN is a Renewable Identification Number from the U.S. Environmental Protection Agency). The scenarios were selected based on 1) the focus of the NY Climate Act Scoping Plan to use energy close to its generation point and to use renewable sources, and 2) to model the common practice of separating solids after AD and the opportunity to capture remaining CH4 emitted from the effluent storage.
- Biogas boiler for digester heating
- Biogas combined heat and power (CHP) sized for digester heat load
- Onsite zero GHG electricity (e.g., solar) generation for project
- Solid-liquid separation (SLS) of digestate
- SLS of digestate with covered separated liquid storage
- SLS of digestate with covered storage and zero GHG electricity
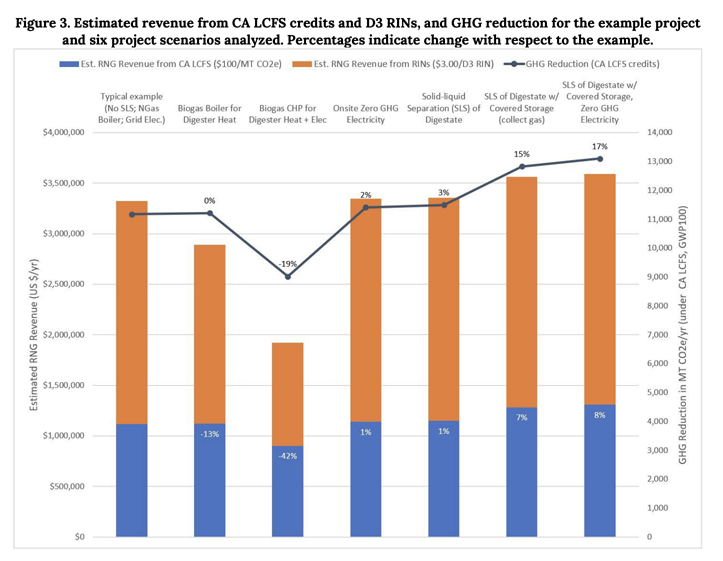
Figure 3 shows the results of each of these project scenarios compared to the example of a typical NY dairy project. GHG reduction under the CA LCFS is calculated by subtracting the project RNG CI score from the transportation fuel that it replaces, taken as diesel in this analysis. An approximate CI benchmark for diesel is 90 g CO2e/MJ6 , resulting in a total GHG reduction of 207 g CO2e/MJ from replacing diesel with the example project RNG or 11,170 MT CO2e per year. This GHG reduction is considered the LCFS credit amount and a value per MT CO2e is assigned. The LCFS credit value will fluctuate over time, as will the benchmark CI for the fuel replaced with the RNG. For this analysis, a $100/MT CO2e value was used for the CA LCFS credit7 , shown in the blue bars in Figure 3. Federal RINs apply to renewable transportation fuel as well, and manure-only AD-to-RNG qualifies as a D3 (cellulosic) fuel with a recent value of $3.00/D3 RIN8 . A RIN is equal to 77,000 BTU of fuel energy. Both revenue values fluctuate with market participation and other factors.
Key observations include:
- Utilizing some of the biogas produced to fuel a boiler to supply the digester’s heating demand results in a negligible change in the project’s total GHG reduction (and CA LCFS revenue), but does negatively impact the RINs revenue (-13%) that is based on total volume of supplied transportation fuel.
- New York State’s electricity grid in the upstate region has minimal GHG emissions, which makes utilizing CHP fueled by some of the biogas unattractive (from a GHG reduction standpoint) and utilizing onsite zero GHG electricity generation minimally beneficial (2% gain in GHG reduction and 1% gain in revenue). However, the difference in cost of electricity from these sources is another factor to consider that was not modeled in this analysis.
- Covering the digester’s effluent (digestate) storage is a significant opportunity to improve the CI score and total project GHG reduction (15% gain) as well as realize increased revenue (estimated at 7%).
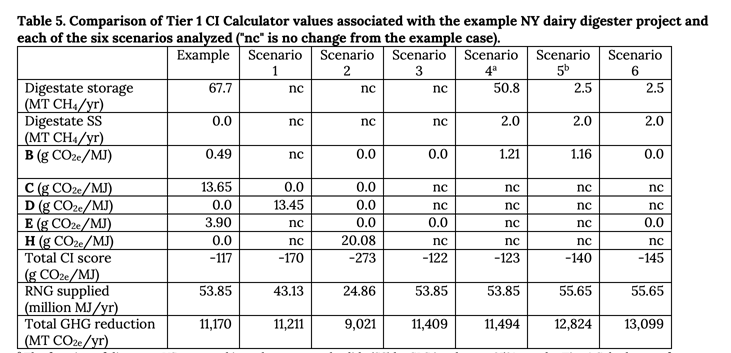
Table 5 on the following page provides each CI score component that was impacted by the different project scenarios as compared to the example dairy AD project, as well as the difference in product RNG supplied (i.e., exported) and total GHG reduction assuming transportation diesel fuel replacement. Where applicable, the “code” is referenced from Table 3.
Summary
The information provided in this analysis report of the CA LCFS CI score applied to biomethane (or RNG) produced from dairy manure AD located on a NY dairy farm can be used to understand the different CI score components and relative importance of them, as well as the opportunities to improve the score, total GHG reduction, and revenue. As NY begins to implement its Climate Act Scoping Plan, consideration of its own transportation fuel standard would allow for RNG end use within the state (avoiding the substantial GHG emission associated with lengthy pipeline transport to CA) and would apply the 20-year GWP to CH4 emissions (84 times CO2). The latter alone results in a CI score of negative 525 g CO2e per MJ, yielding three times more GHG reduction opportunity (approximately 33,000 MT CO2e per year), for this 3,000-cow dairy AD-to-RNG for transportation fuel example.
1 New York State. (2022). Climate Act Scoping Plan. https://climate.ny.gov/resources/scoping-plan/.
2 California Air Resources Board (CARB). August 13, 2018. Tier 1 Simplified CI Calculator for Biomethane from Anaerobic Digestion of Dairy and Swine Manure. https://ww2.arb.ca.gov/resources/documents/lcfs-life-cycle-analysis-modelsand-documentation.
3 Climate Action Reserve. https://www.climateactionreserve.org/how/protocols/waste/organic-waste-digestion/.
4 USDA NRCS National Engineering Handbook. (2019). Title 210-637-H, Chapter 4: Solid-Liquid Separation Alternatives for Manure Handling and Treatment.
5 Shelford, T., C. Gooch, A. Choudhury, and S. Lansing. (2019). A Technical Reference Guide for Dairy-Derived Biogas Production, Treatment, and Utilization. Cornell Dairy Environmental Systems. https://hdl.handle.net/1813/60803.2.
6 CARB. https://ww2.arb.ca.gov/resources/documents/lcfs-basics. (Accessed 2/17/23).
7 CARB. https://ww2.arb.ca.gov/resources/documents/weekly-lcfs-credit-transfer-activity-reports. (Accessed 2/17/23).
8 U.S. EPA. https://www.epa.gov/fuels-registration-reporting-and-compliance-help/rin-trades-and-price-information. (Accessed 2/17/23).
9 Gooch, C.A., S.F. Inglis, and K.J. Czymmek. (2005). Mechanical Solid-Liquid Manure Separation: Performance Evaluation on Four New York State Dairy Farms – A Preliminary Report. Presented at the 2005 ASAE Annual International Meeting, July 17 – 20, 2005. ASAE Paper No. 05-4104. ASAE 2950 Niles Road, St. Joseph, MI.



Be the first to comment