

This Post will cover the trends in sales of fluid (drinking) milk in the U.S. This is an update from the February 21, 2021 post to this blog.
Fluid milk sales have been declining at about two percent annually prior to 2020. In 2020, there was a significant increase in milk consumption as eating habits were formed around the “Stay at Home” mandates implemented with COVID. In 2021, sales are again falling into the long-term declining trends. Most of the data in this post is based on 12-month averages to reduce short-term fluctuations and better define long-term trends.
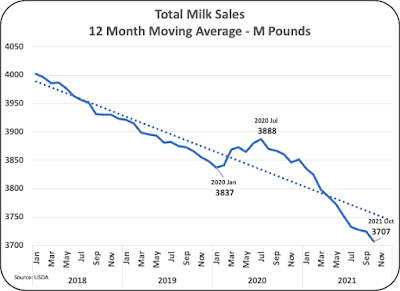 |
| Chart I – Total Fluid Milk Sales |
Chart II below expresses the annual changes as a percent. As mentioned above, prior to COVID, fluid milk sales were averaging around a two percent annual decline. In 2020 the decline slowed ti near “0” and two months in 2020 even provided positive increases. However, by 2021, a significant decline began again. While the decline is currently averaging around four percent annually, some of that can be attributed to the inflated numbers from the prior year.
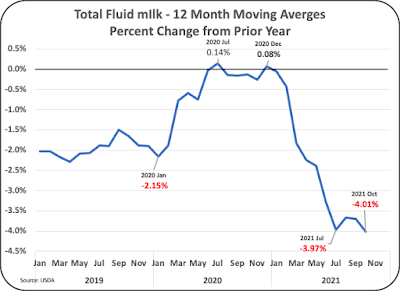 |
| Chart II – Milk Sales – Percent change from Prior year |
As of October 2021, the pie chart below illustrates the split between whole milk, two percent fat milk, one percent fat milk, and fat free milk. Whole milk and two percent fat milk are nearly the same size. One percent fat and fat free milk are much smaller and declining faster.
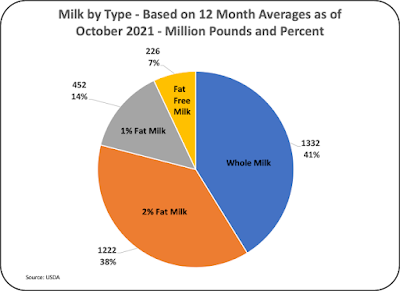 |
| Chart III – Current Milk Sales by Type of Milk |
In the April 25, 2021 post to this blog entitled “The Amazing Success of Organic Milk”, organic milk showed significant growth. During the pandemic, the growth increased to new record highs, reaching a 12 percent increase over the prior year based on the 12-month average data. It has recently started declining in 2021, but not as fast as conventional milk.
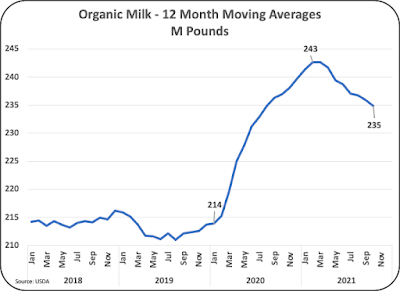 |
| Chart IV – Organic Milk Sales |
To put this in perspective, Chart V shows the comparison between conventional and organic milk. Conventional milk sales have continued to decline, and organic milk sales show an increase over the span of this chart. However, organic milk is still a niche product making up only six percent of total milk sales. However, this is a half percent increase from early 2018 when organic milk made up about 5.5 percent of the total milk consumed.
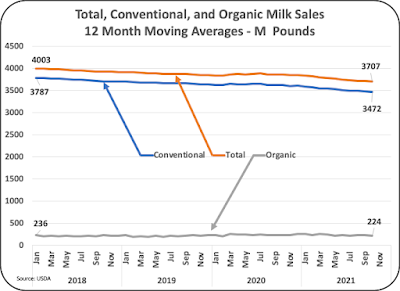 |
| Chart V – Conventional and Organic Milk Sales |
Charts VI through IX show the growth by type of milk. The charts for whole milk and two percent milk show the 2020 growth during the pandemic followed by a steep decline in 2021. However, there is one big difference. Whole milk, Chart VI, had been increasing in volume prior to the pandemic, but it is now falling below pre pandemic levels. Two percent milk, Chart VII, appears to have returned to the pre pandemic declining levels.
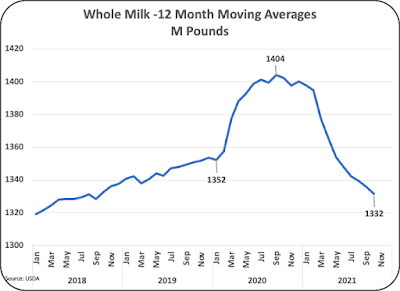 |
| Chart VI – Whole Milk Sales |
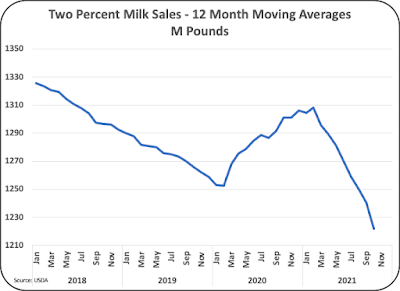 |
| Chart VII – Two Percent Fat Milk Sales |
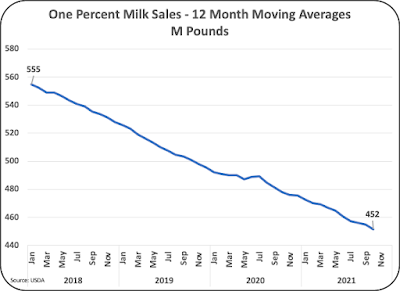 |
| Chart VIII – One Percent Fat Milk Sales |
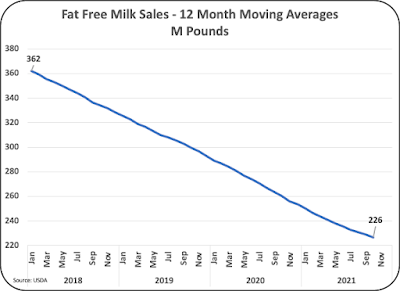 |
| Char IX – Fat Free Milk Sales |


Be the first to comment